

0 引言
天然气水合物俗称“可燃冰”,是类冰状的结晶化合物,由水分子与气体分子在高压低温的环境下形成。水合物中的主体水2分子通过氢键结合形成笼形结构,气体分子填充在笼形结构内[1,2]。自然界中的天然气水合物广泛分布在大陆永久冻土以及海底深处。据估计,天然气水合物中的碳含量是常规化石燃料碳含量的2倍[3],天然气水合物作为一种潜在的资源已经得到了广泛的关注[4]。天然气水合物开采方法包括降压法[5,6,7,8]、热激法[9]、注抑制剂法[10,11]和固态流化法[12]等。天然气水合物在多孔介质中以固体的形式存在,固体水合物分解后形成甲烷气与水两相,甲烷气与水在多孔介质中的流动与多孔介质的渗透率有关,多孔介质的渗透率是影响水合物开采的关键因素之一。多孔介质渗透率与水合物的饱和度和水合物的赋存形式有关[13]。在水合物开采过程中孔隙内水合物的饱和度逐渐降低,随之引起多孔介质渗透率的显著变化。定量研究渗透率随水合物饱和度的变化对水合物开采具有十分重要的理论价值和工程意义。
目前已经有部分关于含水合物的多孔介质渗透率实验与理论研究。在实验研究方面,KLEINBERG等[14]对含甲烷水合物的砂岩进行了核磁共振测量,结果表明水合物趋于在孔隙中心生成而不是包裹颗粒表面生成。KUMAR等[15]以0.088 9 ~ 0.149 86 mm直径的玻璃珠为多孔介质,生成饱和度为20% ~ 49%的CO2水合物,采用恒流速CO2注入法测量气相渗透率,实验结果表明当水合物饱和度小于35%时,水合物在颗粒表面生成,饱和度大于35%时,水合物在孔隙中心生成。JOHNSON等[16]测量了含甲烷水合物的天然岩心样品的渗透率,水合物饱和度范围为1.5% ~ 36%,采用水、氮气测量气-水两相渗透率,实验结果表明很低的水合物饱和度就能显著降低多孔介质的渗透率。LIU等[17]采用冰粉颗粒与高岭土混合的方法生成甲烷水合物,测量含水合物高岭土气相渗透率,结果表明高岭土的气相渗透率随水合物饱和度的增加先降低后增大。LI等[18]采用三种不同粒径(200 ~ 300 μm、300 ~ 450 μm、450 ~ 600 μm)的石英砂作为多孔介质,生成饱和度为0 ~ 31%的甲烷水合物。实验结果表明石英砂的绝对渗透率随着粒径增大而升高,当水合物饱和度为0 ~ 10%时渗透率随饱和度增大而快速降低,饱和度大于10% 时,渗透率下降趋势变得缓慢。由上述实验研究可知,水合物渗透率实验的研究内容主要为渗透率的变化规律和水合物的赋存形式。主要实验变量有多孔介质类型、水合物种类、水合物生成方法以及渗透率测量方法,这些实验变量对渗透率变化和水合物赋存形式存在影响。MAHABADI等[19]的研究表明采用过量气的水合物生成方法容易在孔喉处生成水合物,导致较少的水合物就能显著降低多孔介质的渗透率。因此需要明确含水合物的多孔介质渗透率在特定实验条件下的具体变化趋势。
在水合物渗透率模型研究方面,KLEINBERG等[14]总结了含水合物的平行毛细管模型和Kozeny- Carman模型。DAI等[20]利用孔隙网络模型模拟了水合物在孔隙内的不均匀分布,基于Kozeny-Carman模型对迂曲度进行修正得到了一个完全用水合物饱和度表示的渗透率公式。LI等[18]提出了两种水合物孔隙填充渗透率模型,分别适用于甲烷水合物饱和度低于10%和高于10%时的情况,第一种为毛细管水合物孔隙中心填充模型,第二种模型为均匀颗粒球体堆积水合物孔隙中心填充模型。以上含水合物的渗透率模型均是基于平行毛细管模型或Kozeny- Carman模型进行推导,但这两种模型都是简单理想模型,平行毛细管模型假定多孔介质孔隙由毛细管束组成,但没有表征毛细管管径的分布,而Kozeny- Carman模型利用多孔介质孔隙度和比表面积等参数对孔隙分布进行平均化表征,因此为了模型的准确性需要对孔隙分布进行具体的量化分析。有研究表明,多孔介质的孔隙结构具有分形特征[21,22],孔隙大小分布满足分形标度关系。学者们提出了多孔介质渗透率的分形模型,并且分形模型与实验数据符合良好[23,24,25]。目前部分研究将分形理论成功运用在水合物的结晶过程[26],而在水合物渗透率分形研究方面,刘乐乐等[27]提出了一个含水合物沉积物渗透率的分形模型,通过文献数据反演得到了模型中的参数值。刘乐乐等[28]随后采用CT图像处理技术得到了多孔介质中孔隙、水相和气相的面积分形维数和迂曲度分形维数,提出了含水合物的气-水两相相对渗透率分形模型。目前含水合物的渗透率分形模型研究较少,模型中的多个参数没有明确取值,因此需要结合含水合物的渗透率实验数据确定渗透率分形模型中参数的取值范围。
本文从实验和模型两个方面来研究含水合物的石英砂渗透率变化规律。实验研究方面,在石英砂孔隙中生成了一系列饱和度的甲烷水合物,采用稳态注水的方法测量了含水合物的石英砂渗透率,分析了甲烷水合物的生成与渗透率测量过程,得到了石英砂渗透率随水合物饱和度的变化趋势。理论模型研究方面,将两种水合物的赋存形式(颗粒包裹、孔隙填充)下的石英砂渗透率分形模型与实验数据进行了对比,验证了渗透率分形模型的准确性,确定了一定粒径范围的石英砂渗透率分形模型的参数取值,同时得到了水合物在不同水合物饱和度范围内的赋存形式。
1 实 验
1.1 实验设备
含水合物的石英砂渗透率测量实验设备如图1所示。圆柱形反应釜由316L不锈钢制成,内部直径20 mm,有效长度250 mm,耐压25 MPa,内部有效体积为81.80 mL。沿反应釜轴向上分布有三个温度传感器(Pt1000, -15 ~ 90℃, ±0.01℃)标记为T1、T2、T3,分别距离进口端面15 mm、125 mm、235 mm。反应釜进出口两端连接有两个压力传感器P1、P2(0 ~ 25 MPa, ±0.25%)测量反应釜进出口压力,同时进出口两端还连接有差压传感器ΔP(Honeywell STD730-E1AC4AS, 0 ~ 400 KPa, 0.25%)用于精确测量差压。储气罐的有效容积为251.50 mL,最高耐压34 MPa,顶部连接温度传感器T4和压力传感器P3。平流泵为北京创新通恒有限公司的HPLC3000A型,流量范围0 ~ 50 mL/min,流量精度 ±0.01 mL/min,压力范围为0 ~ 30 MPa。两个电子天平(Sartorius BSA 2202S, 0 ~ 2 200 g, ±0.01 g)分别计量进出口的水量。恒温水浴控温范围为 -5 ~ 90℃(±0.05℃)。反应釜、储气罐、冷却盘管均放置在恒温水浴内。回压阀用来控制反应釜出口处的压力,回压阀压力控制范围为0 ~ 30 MPa。反应釜出口流体经过回压阀后再由气体分离器分离,出气量由气体流量计(北京七星华创D07-19B型,2 ~ 200 mL/min,精度1%)计量。所有的压力传感器、温度传感器、差压传感器与电子天平均与数据采集系统连接实时记录实验数据,记录时间间隔为15 s。
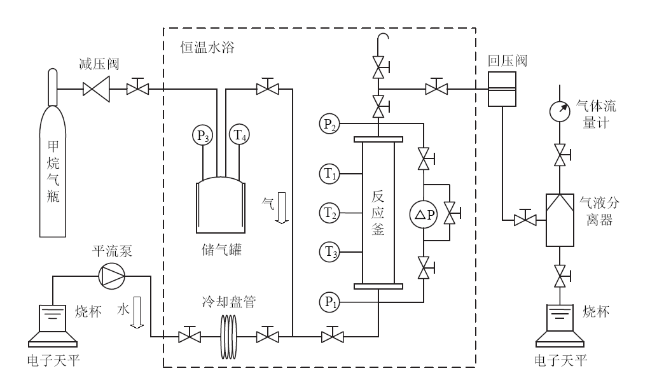
Fig. 1 Schematic of the experimental apparatus for permeability measurements of hydrate-bearing quartz sand图1 含水合物的石英砂渗透率测量实验设备图 |
1.2 实验试剂与步骤
甲烷由佛山华特气体有限公司提供,纯度为99.9%。去离子水电阻率为18.25 mΩ/cm,由超纯水设备制备(南京易普易达科技发展公司GREEN-10T型)。石英砂粒径由Mastersizer 2000E型激光微米粒度仪测量,粒径范围为52.481 ~ 301.995 μm,体积平均粒径139.612 μm。采用ULTRAPYV 1200e型自动密度分析仪测得石英砂密度为2.536 g/cm3。
将116.12 g石英砂均匀地填充至反应釜内,并饱和注水测量得到有效孔隙体积Vp为37.59 mL,计算出初始孔隙度${{\phi }_{0}}$为45.95% [ (37.59/81.80) × 100%]。采用水饱和的方法生成甲烷水合物,反应结束后气相饱和度低于15%。水浴温度始终保持8.0℃。向反应釜内注入去离子水,当去离子水充满整个反应釜后,注入少量甲烷气体排出一定量的水,该过程为后面注入的甲烷气体提供了一定的体积。然后再次打开储气罐向反应釜内注入高压甲烷气,注入的甲烷气量根据注气前后储气罐的温度压力变化计算得到。待注入的气体达到稳定状态后,向反应釜内注入去离子水直到釜内压力达到20 MPa左右,关闭反应釜所有进出口阀门,直至水合物生成结束。水合物生成过程中反应釜内存在气-液-固三相,实时的各相饱和度由系统压力、温度和体积变化计算得出[18]。水合物生成结束后开始测量渗透率。以1.0 mL/min的速度向反应釜内注入去离子水,实时记录反应釜两端的差压值,根据达西定律计算有效渗透率:
$K=\frac{\mu QL}{\text{ }\!\!\pi\!\!\text{ }{{r}^{2}}\Delta P}$ (1)
式中:K为多孔介质的有效渗透率,m2;μ为注入流体的动力黏度,Pa∙s;Q为注入流体的流量,m3/s;L为多孔介质的样品长度0.25 m;r为反应釜的横截面半径0.01 m;$\Delta P$为测量过程中反应釜进出口两端的差压,Pa。渗透率单位换算为1 Darcy = 0.987 × 10⁻¹² m2。
含水合物的渗透率研究中,常用渗透率比Kr表示多孔介质渗透比随水合物饱和度的关系。渗透率比Kr[18]定义为含饱和度Sh水合物时多孔介质渗透率Kh与不含水合物时多孔介质绝对渗透率K0之比,即:
${{K}_{\text{r}}}=\frac{{{K}_{\text{h}}}}{{{K}_{0}}}$ (2)
2 含水合物的渗透率二维分形模型
YU等[23]采用分形维数表征了多孔介质的孔隙分布,并提出了多孔介质渗透率的分形模型为:
$K=\frac{\text{ }\!\!\pi\!\!\text{ }}{128\tau A}\frac{{{D}_{f}}}{4-{{D}_{f}}}\lambda _{\max }^{4}$ (3)
式中:Df为多孔介质的面积分析维数;$\tau$为迂曲度;λmax为最大孔隙直径。
当多孔介质内含有一定饱和度的水合物时,含水合物的多孔介质渗透率比Kr可表示为[27]:
${{K}_{r}}=\frac{{{K}_{\text{h}}}}{{{K}_{0}}}=\frac{{{\tau }_{0}}}{{{\tau }_{\text{h}}}}\frac{{{D}_{f,\text{h}}}}{4-{{D}_{f,\text{h}}}}\frac{4-{{D}_{f,0}}}{{{D}_{f,0}}}{{\left( \frac{{{\lambda }_{\max ,\text{h}}}}{{{\lambda }_{\max ,0}}} \right)}^{4}}$ (4)
文献[14]给出了一个含有饱和度指数n的迂曲度模型拟合不同的迂曲度变化趋势,本文提出以下简化的迂曲度模型:
$\frac{{{\tau }_{0}}}{{{\tau }_{\text{h}}}}={{\left( 1-{{S}_{\text{h}}} \right)}^{n}}$ (5)
式中:n为饱和度指数,n代表了水合物与多孔介质的特性等因素对迂曲度的影响,目前没有明确的取值。
多孔介质的面积分形维数Df可采用计盒维数法分析图像得到。YU等[21]推导了多孔介质面积分形维数Df的解析表达式,二维情况下,Df与多孔介质孔隙率$\phi $、最大孔径${{\lambda }_{\max }}$和最小孔径${{\lambda }_{\min }}$的关系为:
${{D}_{f}}=2-\frac{\text{ln}\phi }{\text{ln}\left( \frac{{{\lambda }_{\min }}}{{{\lambda }_{\max }}} \right)}$ (6)
假设水合物在孔隙空间内均匀生成,则最小与最大孔径之比${{\lambda }_{\min }}/{{\lambda }_{\max }}$可视为定值。含水合物时的面积分形维数Df计算为[27]:
${{D}_{f}}=2-\frac{\text{ln}\left[ {{\phi }_{0}}\left( 1-{{S}_{\text{h}}} \right) \right]}{\text{ln}\left( \frac{{{\lambda }_{\min }}}{{{\lambda }_{\max }}} \right)}$ (7)
${{\lambda }_{\min }}/{{\lambda }_{\max }}$的取值一般在10-2 ~ 10-4范围内[22],在渗透率分形模型中,${{\lambda }_{\min }}/{{\lambda }_{\max }}$对渗透率比Kr的计算结果影响较小。LIU等[28]测量了孔隙度为51%的石英砂的面积分形维数为1.864,当式(7)取${{\lambda }_{\min }}/{{\lambda }_{\max }}={{10}^{-2}}$时计算得到Df = 1.853,该计算值与测量值近似。因此,本文取${{\lambda }_{\min }}/{{\lambda }_{\max }}={{10}^{-2}}$计算面积分形维数。本次实验中初始孔隙度为45.95%的石英砂初始面积分形维数Df ,0计算结果为1.887。
对于不同的水合物赋存形式,最大孔径比${{\lambda }_{\max ,h}}/{{\lambda }_{\max ,0}}$随水合物饱和度Sh的变化有不同的趋势,图2为不同水合物赋存形式下孔隙截面示意图。
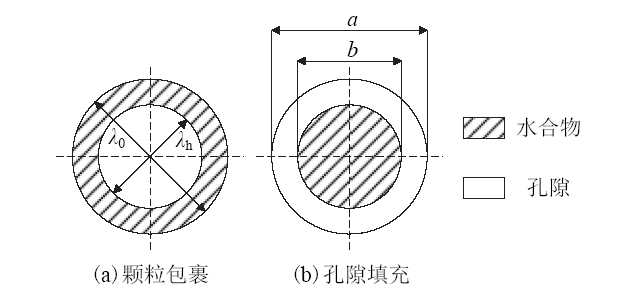
Fig. 2 Schematic of pore cross-section with different hydrate occurrence forms图2 不同水合物赋存形式下的孔隙截面示意图 |
$\frac{{{\lambda }_{\text{h}}}}{{{\lambda }_{0}}}=\sqrt{1-{{S}_{\text{h}}}}$ (8)
因此水合物生成前后最大孔之比${{\lambda }_{\max ,h}}/{{\lambda }_{\max ,0}}$满足关系式(8)。
$q=\frac{\text{ }\!\!\pi\!\!\text{ }}{128}\frac{\Delta P}{\mu \tau L}\left[ {{a}^{4}}-{{b}^{4}}-\frac{{{\left( {{a}^{2}}-{{b}^{2}} \right)}^{2}}}{\ln \left( \frac{a}{b} \right)} \right]$ (9)
式中:a为毛细管的直径,b为水合物颗粒的直径, a、b之间的关系计算为:
$\frac{b}{a}=\sqrt{{{S}_{\text{h}}}}$ (10)
a相当于不含水合物的初始孔径λ0,将式(10)代入式(9)中可得:
$q=\frac{\text{ }\!\!\pi\!\!\text{ }}{128}\frac{\Delta P}{\mu \tau L}\lambda _{0}^{4}\left[ 1-S_{\text{h}}^{2}+\frac{2{{\left( 1-{{S}_{\text{h}}} \right)}^{2}}}{\ln {{S}_{\text{h}}}} \right]$ (11)
根据泊肃叶方程,流体通过单根毛细管通道时的流量q为[14]:
$q=\frac{\text{ }\!\!\pi\!\!\text{ }}{128}\frac{\Delta P}{\mu \tau L}{{\lambda }^{4}}$ (12)
与式(12)相比,式(11)相当于对含孔隙填充型水合物的环形流动通道的有效流动直径进行了修正,即:
${{\lambda }_{\text{h}}}={{\lambda }_{0}}{{\left[ 1-S_{\text{h}}^{2}+\frac{2{{\left( 1-{{S}_{\text{h}}} \right)}^{2}}}{\ln {{S}_{\text{h}}}} \right]}^{\frac{1}{4}}}$ (13)
故${{\lambda }_{\max ,h}}/{{\lambda }_{\max ,0}}$计算为:
$\frac{{{\lambda }_{\max ,\text{h}}}}{{{\lambda }_{\max ,0}}}={{\left[ 1-S_{\text{h}}^{2}+\frac{2\left( 1-S_{\text{h}}^{2} \right)}{\ln {{S}_{\text{h}}}} \right]}^{\frac{1}{4}}}$ (14)
将式(5)、式(7)、式(8)、式(14)代入式(4)可得到在颗粒包裹与孔隙填充两种水合物赋存形式下的多孔介质渗透率分形模型。
3 结果与分析
3.1 甲烷水合物生成
表1给出了水合物生成后的液相饱和度Sw、水合物饱和度Sh以及渗透率测量过程中的压力P、温度T、液相黏度μ、有效渗透率K以及渗透率比Kr。以实验9为例说明甲烷水合物的生成过程,图3给出实验9甲烷水合物生成过程中反应釜进出口压力、水合物饱和度Sh和气相饱和度Sg随时间的变化曲线。水合物生成的初始压力21.22 MPa,远大于反应釜内8℃下甲烷水合物的相平衡压力5.74 MPa,水合物在较高的压力驱动力下开始生成。从图3中可以看出t < 422 min时反应釜进出口压力迅速下降,Sh快速增加。水合物生成过程中进出口压力出现不一致现象,这种现象是由生成的水合物堵塞流动通道造成的。随着釜内甲烷水合物的不断生成和甲烷气体的消耗,釜内的压力逐渐降低且其降低趋势逐渐变缓,表明水合物的生成速率在逐渐下降。为了提高水合物的生成速率,在t = 1 837 min时刻向釜内二次注入去离子水以提高反应釜内的压力。注入去离子水2.71 g,釜内压力从13.74 MPa升至21.22 MPa。二次注水过程中Sh保持不变,Sg从23.63%下降至15.45%。t = 6 152 min时釜内压力达到16.45 MPa,计算得出Sh为28.28%,此时水合物生成过程结束,随即开始渗透率测量实验。水合物的生成实验一般持续时间较长,在生成较高饱和度的水合物时,可以向反应釜内多次注入去离子水以提高水合物的生成速率。
Table 1 Experimental data of methane hydrate formation and permeability measurements表1 甲烷水合物生成、渗透率测量实验数据 |
| 实验编号 | 液相饱和度 Sw / % | 水合物饱和度 Sh / % | 压力 P / MPa | 温度 T / ℃ | 液相黏度 μ / (×10-3 Pa·s) | 渗透率 K / Darcy | 渗透率比 Kr |
|---|---|---|---|---|---|---|---|
| 0 | 100.00 | 0.00 | 15.31 | 281.11 | 1.369 | 9.282 | 1.000 |
| 1 | 92.67 | 2.52 | 15.43 | 281.15 | 1.368 | 7.266 | 0.783 |
| 2 | 89.45 | 2.92 | 15.35 | 281.23 | 1.365 | 7.216 | 0.777 |
| 3 | 84.70 | 6.76 | 18.86 | 281.23 | 1.361 | 3.111 | 0.335 |
| 4 | 77.93 | 11.83 | 17.98 | 281.13 | 1.365 | 1.799 | 0.194 |
| 5 | 77.90 | 13.19 | 15.70 | 281.09 | 1.368 | 0.277 | 0.030 |
| 6 | 69.05 | 19.81 | 16.51 | 281.09 | 1.369 | 0.120 | 0.013 |
| 7 | 70.11 | 21.00 | 15.91 | 281.17 | 1.366 | 0.037 | 0.004 |
| 8 | 65.48 | 25.89 | 18.47 | 281.02 | 1.369 | 0.037 | 0.004 |
| 9 | 62.33 | 28.28 | 15.95 | 281.19 | 1.365 | 0.018 | 0.002 |
| 10 | 59.67 | 28.56 | 11.93 | 281.20 | 1.369 | 0.026 | 0.003 |
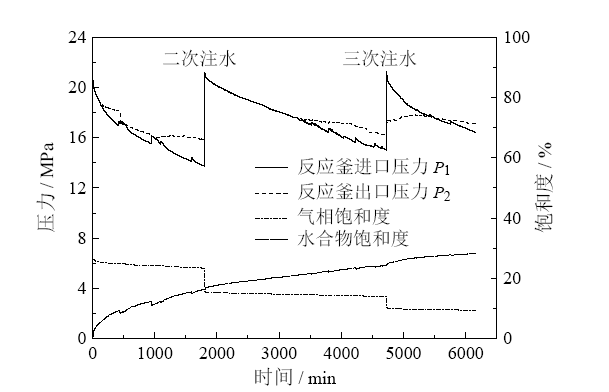
Fig. 3 The pressure and saturation profiles during methane hydrate formation in Run 9图3 实验9甲烷水合物生成过程中压力和相饱和度变化图 |
3.2 渗透率测量
渗透率测量的实验数据如表1所示,图4为实验9(Sh = 28.28%)渗透率测量过程中反应釜进出口压力、差压变化曲线。从图4可以看出反应釜进出口压力维持稳定并远远大于甲烷水合物平衡压力5.74 MPa,保证了测量过程中水合物不发生分解。渗透率测量过程主要分两个阶段,测量初期(t < 0 min)反应釜进出口压差不稳定,并呈现逐渐减小的趋势,该阶段主要为反应釜内剩余气体的驱替过程。在水合物生成结束后,反应釜内存在少量的自由气体,渗透率测量初期注入的去离子水驱替剩余自由气体,气体的排出造成了差压的不稳定。当t > 0 min时,进出口差压值逐渐稳定,可认为剩余自由气体已完全排出,该阶段为渗透率的稳定测量阶段。图5给出了渗透率稳定测量阶段的差压及进出口累计水量变化曲线。稳态测量过程中差压维持在0.94 MPa左右,进口注水速率为0.995 1 g/min、出口产水速率为0.957 2 g/min。注水和产水速率的相关系数R2均大于0.999,表明稳态测量过程中去离子水流速稳定并且反应釜内为液体的单相流动。有研究表明,渗透率测量过程中容易发生水合物的分解和生成的现象[19],水合物的分解和生成会造成渗透率的变化。在本次实验中渗透率稳定测量阶段差压维持较长时间的平衡,可认为在测量过程中水合物没有发生分解或生成的现象。
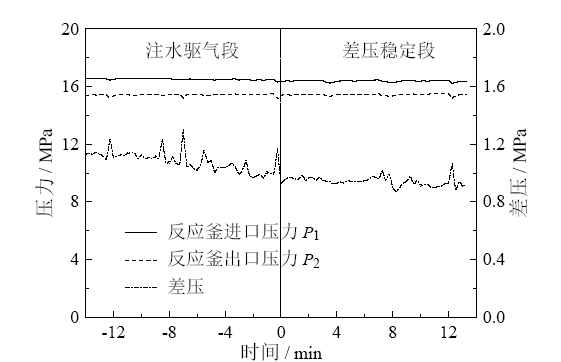
Fig. 4 The pressure and differential pressure profiles during permeability measurement in Run 9图4 实验9渗透率测量过程压力、差压变化曲线 |
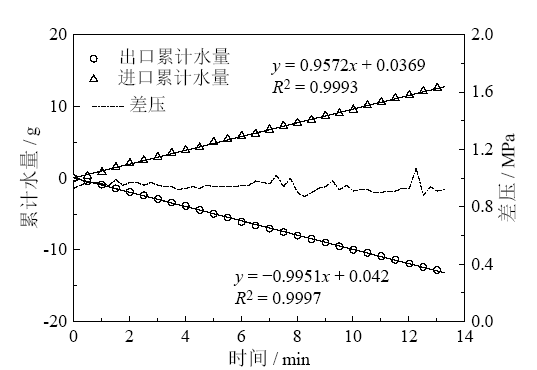
Fig. 5 The differential pressure and the accumulative water profiles during permeability measurement in Run 9图5 实验9(Sh = 28.28%)渗透率测量过程差压、累计水量变化曲线 |
3.3 渗透率比与水合物饱和度的关系
图6为石英砂渗透率实验数据与分形模型的对比。从图中可以看出石英砂渗透率比Kr随水合物饱和度Sh的增大呈现指数减小的趋势。水合物饱和度由0增大到28.56%时,渗透率比Kr从1下降至0.003,水合物的生成显著降低了石英砂的渗透率。当Sh低于11.83%时,Kr下降缓慢;当Sh大于11.83%时,Kr下降迅速。实验数据表明在不同的饱和度范围内,石英砂渗透率存在不同的变化趋势,随着水合物饱和度的增加,石英砂渗透率下降速率变快。在生成低饱和度水合物时,反应釜内初始气体量小,在气-液表面生成的水合物在流动通道上占据的面积比较小。在生成高饱和度水合物时,反应釜内的初始气体量较大,气体更容易占据孔隙中心区域。当大量的气体占据孔隙中心时,在气-液表面生成的水合物逐渐向聚集气体的孔隙中心生成。这种在孔隙中心生成的水合物占据了主要的流动通道,大大降低了孔隙的有效流动直径,因此生成的高饱和度水合物对石英砂的渗透率影响更显著。
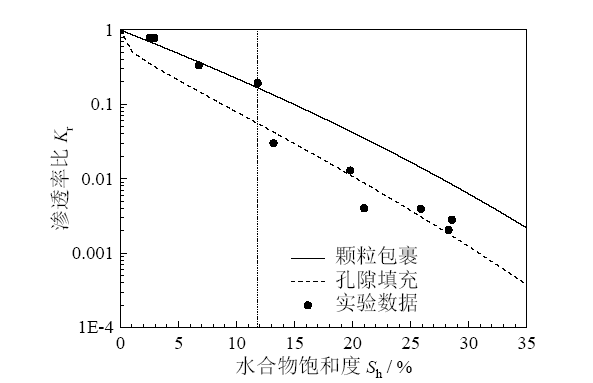
Fig. 6 Comparison between fractal model of permeability and experimental data图6 渗透率分形模型与实验数据对比 |
图6中渗透率分形模型取饱和度指数n = 12,从图中可以看出渗透率分形模型与实验数据吻合较好。颗粒包裹分形模型在较低水合物饱和度范围(${{S}_{\text{h}}}\le 11.83%$)内与实验数据符合较好,孔隙填充分形模型在较高水合物饱和度范围($11.83<{{S}_{\text{h}}}\le $ $28.56%$)内与实验数据符合较好。这表明在低饱和度范围(${{S}_{\text{h}}}\le 11.83%$)内水合物倾向于包裹颗粒表面生成,随着水合物饱和度的增加,水合物倾向于在孔隙中心生成。相比于颗粒包裹型水合物,孔隙填充型水合物更能显著降低多孔介质的渗透率,因此在较高的水合物饱和度范围内,孔隙填充型水合物造成了渗透率比Kr的迅速下降,这与实验现象一致。
4 结论
测量了不同甲烷水合物饱和度(0 ~ 28.56%)下的石英砂渗透率,得到了石英砂渗透率随水合物饱和度的变化趋势,将两种水合物赋存形式(颗粒包裹、孔隙填充)下的多孔介质渗透率分形模型与实验数据进行了对比。结论如下:
(1)石英砂渗透率比Kr随水合物饱和度Sh的增大呈现指数减小的趋势。渗透率比在不同的水合物饱和度范围内存在不同的变化趋势,当水合物饱和度Sh低于11.83%时,Kr下降缓慢;当Sh大于11.83%时,Kr下降迅速。
(2)对于粒径为139.612 μm、孔隙度为45.95%的石英砂,当最小与最大半径取${{\lambda }_{\min }}/{{\lambda }_{\max }}={{10}^{-2}}$并且饱和度指数n为12时,含水合物的渗透率分形模型与实验数据吻合较好。
(3)通过分形模型与实验数据对比,得到在水合物饱和度较低(${{S}_{\text{h}}}\le 11.83%$)时,甲烷水合物为颗粒包裹型的赋存形式,在较高的水合物饱和度($11.83%<{{S}_{\text{h}}}\le 28.56%$)范围内,甲烷水合物为孔隙填充型的赋存形式。
