

0 引言
天然气水合物的动态成藏过程会留下独特的地形地貌、地球化学和地球物理等方面的证据。在天然气水合物富集区,海底滑塌、麻坑群和水合物丘(gas hydrate pingoes)等微地形地貌常常与水合物的分解和烃类气体的渗漏存在密切关联[4]。自身碳酸盐含量与旋回性特征、特定生物标志化合物、生物成因重晶石富集等可以作为分析天然气水合物形成-分解过程以及评价其环境效应的重要证据[5,6,7,8]。在地球物理方面,主要是从双似海底反射层(bottom simulating reflector, BSR)或多BSR的角度来揭示天然气水合物-游离气体系的演化过程。目前世界上典型的双BSR或多BSR仅仅出现在少数地区,如日本南海海槽、挪威西部大陆边缘、布莱克海岭和黑海的多瑙河深海扇等[9,10]。因此,从影响天然气水合成藏的基本要素出发,分析天然气水合物稳定带(gas hydrate stability zone, GHSZ)的演化是了解天然气水合物的成藏演化历史的最基本和有效的手段之一[11]。
南海作为西太平洋的边缘海,蕴藏着丰富的天然气水合物资源。前人针对天然气水合物的动态成藏过程做了大量研究[6-8,12]。末次冰消期的Bølling- Allerød暖期(波令-阿勒罗德事件,简称B/A)和Younger Dryas冷期(新仙女木事件,简称YD)旋回事件是末次冰期-间冰期最后一个千年尺度的冷暖气候快速变化事件。叶黎明等[7]发现南海北部末次冰期以来包括神狐海域在内的多个站位CaCO3含量记录突然降低,这一“低钙事件”与底栖有孔虫壳体δ18O特征以及全球变暖的相位关系表明:南海北部天然气水合物在YD末期很可能发生了一次较大规模的快速分解;神狐海域天然气水合物分解的主要触发因素很可能是底层水团温度上升。陈芳等[12]对南海东沙海域陆坡区973-3柱状样有孔虫同位素和壳体B/Ca比值、碳酸钙和黄铁矿含量进行了分析,发现该岩芯底栖有孔虫和浮游有孔虫的δ13C在末次冰期多个层位均发生负偏,且负偏层位同时出现大量黄铁矿,在负偏层位以下沉积的碳酸盐溶解作用强烈。这些证据表明末次冰期至少发生过4次强度基本相当的甲烷渗漏,造成甲烷渗漏的原因很可能是末次冰期海平面下降引起水合物分解导致的。这些研究成果不仅为南海水合物动态形成过程提供了丰富的地质地球化学证据,也揭示了水合物分解的期次、甲烷通量的变化以及水合物分解释放的诱发因素。
珠江口盆地深水区是我国水合物勘探的重点海域。天然气水合物钻探结果表明该区域含天然气水合物沉积层位于海底之下153 ~ 225 m深度区间,形成水合物所需的气体主要为向上运移和扩散的生物成因甲烷[13]。本文选择珠江口盆地深水区为研究区,充分考虑地温梯度的横向变化和海底温度等数据,采用CSMHYD软件模拟计算了该区域内现今GHSZ厚度的平面分布;同时模拟计算了25 ka以来天然气水合物在末次冰期-间冰期转化过程中水合物稳定带分布范围和厚度的变化特征,在此基础上估算了B/A~YD末期气候旋回中水合物分解释放的总碳量,最后定量分析了末次冰期温压条件变化与水合物稳定带厚度的关系,并初步探讨了水合物分解对环境的影响。本文旨在为理解末次冰期-间冰期南海千年尺度的气候突变事件与水合物分解释放的关联提供参考价值。
1 区域地质背景
珠江口盆地位于南海北部大陆边缘,是一个以新生代为主的大型沉积盆地,在构造单元上主要包括白云凹陷、荔湾凹陷、潮汕坳陷和南部隆起带等。盆地主要经历了三次大构造演化阶段:早始新世到中渐新世的断陷阶段、晚渐新世到中中新世的坳陷阶段及晚中新世以后的块断升降阶段。渐新世与中新世之间发生的白云运动,使得23.8 Ma以来白云凹陷深部地幔上隆产生强烈的热沉降,陆架坡折带由之前位于南部隆起带附近,突变式地跳跃到白云凹陷北侧[14,15]。此后珠江口盆地进入相对稳定期,陆架坡折带未发生明显迁移,持续稳定至今;白云凹陷也由渐新世晚期的浅海陆架环境转为陆坡深水环境[14,15]。本次研究区水深约300 ~ 3 700 m,区内第四纪发育陆架边缘三角洲、深水水道/峡谷群、浊积扇等沉积体。

Fig. 1 (a) Locations of the Pearl River Mouth Basin and the studying area; (b) Bathymetric map of the studying area (water mass direction data from literature [17]; water depth data from National Geophysical Data Center website)图1 (a)珠江口盆地和研究区的位置图;(b)研究区水深地形图(水团方向来自文献[17];水深数据来自NOAA网站) |
2 方法与数据的来源
2.1 GHSZ厚度计算方法
天然气水合物形成后处于水-气体-天然气水合物三相动态平衡的状态。影响相平衡的条件发生变化,天然气水合物的稳定性相应受到影响。这些条件包括海底温度(底水温度)、地层压力、气体组分和孔隙水盐度等。GHSZ是指天然气水合物相平衡曲线与地温梯度曲线和水体中温度-压力曲线所包围的封闭区间。一般而言,海底以下水合物相平衡曲线与地温梯度的交点深度即为天然气水合物稳定存在的最大深度;本文中的GHSZ厚度是指该交点到海底的距离。神狐海域水深大于200 m的海水盐度平均值约为34.5‰[18]。本文基于海底浅层沉积物的孔隙水盐度与海水平均盐度一致的假设下,采用CSMHYD软件模拟计算盐度为34.5‰的NaCl溶液下甲烷水合物稳定域的厚度。
2.2 数据的来源
2.2.1 静水压力
通过对白云凹陷深水区的浅层压力场模拟发现,现今浅部地层压力为常压,压力异常区分布范围有限,主要分布于深水水道内部高孔隙度沉积物中[19]。因此,模拟水合物稳定带厚度的区域分布时,可以忽略局部异常高孔隙流体压力带对天然气水合物相平衡的影响;计算水合物稳定带厚度所使用的地层压力,可以通过海底水深数据转换获得的静水压力来代替。海底水深数据来源于美国国家地球物理数据中心(National Geophysical Data Center,NGDC)的ETOP02数据库。
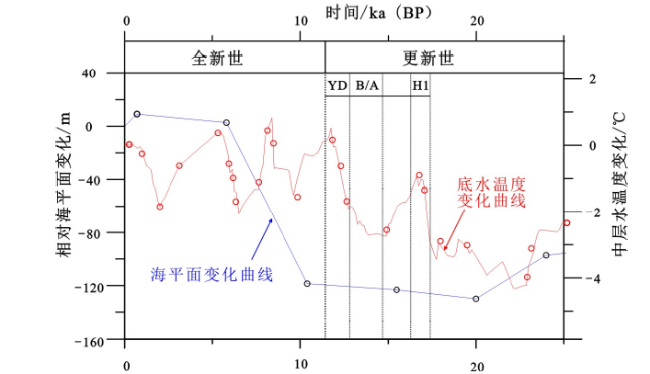
Fig. 2 Relative sea level change and temperature change curve of intermediate waters used to simulate the evolution of GHSZ图2 模拟天然气水合物稳定带演化史所采用的相对海平面变化和中层水温度变化曲线 |
2.2.2 海底温度
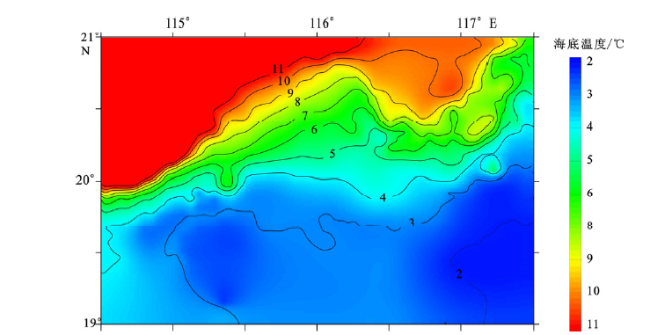
Fig. 3 Contour map of seafloor temperature interpolated from WOA 13 model of the deep water area, the Pearl River Mouth Basin图3 珠江口盆地深水区海底温度分布图 |
水团的性质尤其是温度的变化是影响天然气水合物稳定的重要因素。例如太平洋圣巴巴拉海盆晚第四纪以来天然气水合物频繁地发生大规模的分解,且引起天然气水合物大量分解的因素很可能是北太平洋中层水团变暖[22]。海域天然气水合物常分布在松散的沉积物内,孔隙相互连通并与底层水相连,海底温度的变化常被认为与水团的温度变化一致。南海北部现今的表层水主要来源于西太平洋表层水,而南海表层以下的中层水团和深层水团是由西太平洋相应的水团经巴士海峡入侵南海后形成[23,24]。目前还没有关于南海水团结构和温度在千年尺度上演变的报道。因此,为了简化问题,本文采用基于底栖有孔虫Mg/Ca比值和δ18O获得的西太平洋中层水古温度变化曲线(图2中红色曲线),来定量分析海底温度变化对GHSZ厚度的影响[25]。
2.2.3 地温梯度
南海北部陆坡的大地热流受到地幔热流的控制,具有沿地壳厚度减薄的方向呈上升的趋势。地温梯度等于海底热流密度除以相应沉积物的热导率:
$\text{ }\!\!\Gamma\!\!\text{ }=\frac{Q}{\lambda }$ (1)
式中:Γ 为地温梯度,℃/m;Q为热流密度,W/m2;λ为沉积物热导率,W/(m∙℃)。
地温梯度数据主要有两个来源,即钻孔测量数据和海底热流探针测量数据。前人往往直接利用这两种来源的地温梯度数据计算水合物稳定带厚度。而实际上,由海底地热探针测量得到的海底表层地温梯度一般明显高于钻孔测温数据得到的地温梯度。这是由于在沉积物生热效应与披覆效应的共同作用下,通过热流探针所获得的海底表层热流与同一位置处钻孔测量热流差异很小,但是热导率因沉积物孔隙度随深度降低而逐渐增大且变化范围较大[26,27]。例如,通过对收集的热导率统计发现,珠江口盆地海底热流探针测得的原位热导率介于0.84 ~ 0.88 W/(m∙℃) 之间,而钻孔资料所获得的热导率介于1.64 ~ 1.8 W/(m∙℃) 之间。为了获得GHSZ内的平均地温梯度,本文从国内公开发表的文献中收集了研究地区的热流数据[28,29,30,31],利用公式(1)计算地温梯度时,其中平均热导率采用SH-2钻孔海底20 ~ 230 m深度范围内的平均值1.34 W/(m∙℃)[26]。如图4所示珠江口盆地深水区的地温梯度具有由陆缘向中央海盆方向逐渐升高的趋势,是一个具有高地温梯度背景的海域。地温梯度变化区间45 ~ 75℃/km,平均热流值为60℃/km。
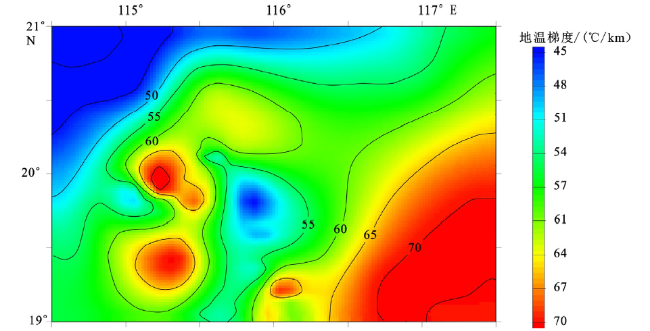
Fig. 4 Contourmap of average geothermal gradient in GHSZ in deep water area of the Pearl River Mouth Basin图4 珠江口盆地深水区水合物稳定带内平均地温梯度分布图 |
3 结果与讨论
3.1 GHSZ的分布
采用最小曲率插值法(minimum curvature)对研究区进行网格离散划分,共划分出4 950个(90 × 55)网格块。利用网格化方法得出同一坐标点处海水深度、海底温度和地温梯度。根据前述原理,计算现今甲烷水合物稳定带厚度。整体上看,GHSZ随着海水加深,从凹陷边缘向凹陷中心呈现逐渐增厚趋势(图5)。天然气水合物出现的最小水深约为600 m,分布面积为4.63 × 10⁴ km2。水深在600 ~ 800 m之间时,水合物稳定带厚度不足100 m。水深小于600 m的区域由于海底温度偏高,不存在水合物稳定带。
GHSZ厚度的面积加权平均值为245 m。厚度最大的区域呈条带状或环状分布于研究区的南部,厚度超过330 m;若同时匹配良好的构造条件、沉积条件和气源条件,则该区域可形成具有较大资源潜力的水合物矿藏,是有利的水合物勘探区。1 750 ~ 3 000 m的水深范围内,由于海底温度在2 ~ 3℃之间窄幅波动,GHSZ呈慢速增厚的特征。为检验GHSZ厚度分布图的精度,分别选取水合物钻探航次GMGS-1和GMGS-3的SH-2井和W-11井进行对比。SH-2井和W-11井测井解释水合物稳定带底界面深度分别为221 m和201 m[13,32]。采用本文所述方法计算的SH-2井和W-11井GHSZ厚度分别为229 m和211 m,相对误差分别为3.62%和5%,精度较高。
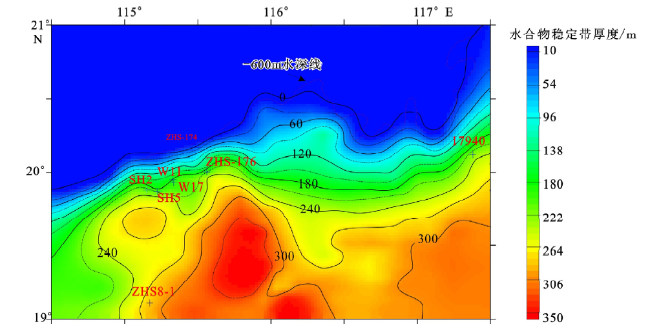
Fig. 5 Isopach map of the GHSZ in deep water area of the Pearl River Mouth Basin图5 珠江口盆地深水区GHSZ厚度分布 |
3.2 GHSZ的演化
假设地温梯度不变,根据25 ka以来研究区水深变化、海底温度变化数据,模拟GHSZ厚度的变化。总体来看,25 ka以来神狐海域GHSZ厚度呈现旋回变化的特征;全新世整体厚度要小于末次冰期,且在12.9 ~ 11.6 ka(即YD时期)处厚度最小,海因里奇1(Heinrich1,H1)事件时期次之(图6)。以ZHS-176站位为例,25 ka以来GHSZ厚度在182 ~ 271 m之间变化,平均厚度为227 m,现今厚度为205 m;该站位更新世GHSZ平均厚度大于全新世时期,分别为239 m和212 m(图6)。如前所述,600 ~ 800 m水深范围内水合物稳定带厚度不足100 m,该区域内水合物稳定带厚度对海平面和海底温度的变化非常敏感。例如ZHS-174站位水深仅640 m,处于天然气水合物稳定带出现与否的临界位置,因而与ZHS-176站位相比,水合物稳定带厚度变化的相对幅度较大。具体而言,ZHS-174站位的天然气水合物稳定带现今厚度为23.6 m;20 ka至今,厚度在0 ~ 80 m之间变化,平均厚度为39 m。ZHS-174站位更新世和全新世水合物稳定带平均厚度分别为44 m和32 m。在22.3 ka左右,ZHS-174站位水合物稳定带厚度达到最大值,约为80 m,相对现今水合物稳定带厚度而言增厚了56.4 m,是现今厚度的2.39倍;而H1和YD末期,ZHS-174站位水合物稳定带厚度为0 m,不存在水合物稳定赋存的温压条件。同时,以现今水合物稳定带厚度为基准,ZHS-176站位水合物稳定带变化幅度明显小于ZHS-174站位,其最大增厚了66 m,最大减薄为23 m,增减幅度分别为32.2%和11.2%。
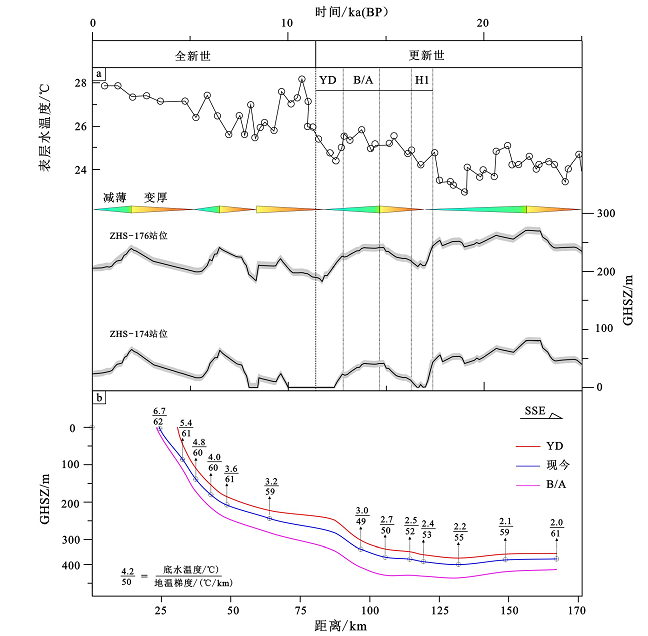
Fig. 6 The evolution of the GHSZ in the South China Sea since 25 ka图6 25 ka以来珠江口盆地天然气水合物稳定带厚度的演化(图a表示ZHS-16站位的25 ka以来水合物稳定带厚度变化,其中灰色阴影表示95%的置信区间;图b表示不同时期剖面上水合物稳定带厚度的变化,剖面位置见图1) |
浮游有孔虫和底栖有孔虫的氧同位素和Mg/Ga比值变化特征表明:末次冰期以来太平洋表层水、次表层水和底层水的温度变化不同步,存在0.8 ~ 1.2 ka的相位差异[24];这导致YD冷期时表层水温度低于B/A暖期时的表层水温度,而中层水温度却高于B/A暖期时的温度;GHSZ厚度也相应地比B/A暖期时薄。B/A时期中层水温度相对现今温度下降了约2.6℃,海平面下降了约125 m。YD末期海平面相对现今下降约120 m,温度约升高了0.5℃。在此温度和压力变化的基准上,以过研究区中部的剖面为例,分析B/A、YD和现今天然气水合物厚度在剖面上的演化。如图6b所示,随着水深的加深,水合物稳定带厚度逐渐增加。3 000 m处水合物稳定带厚度最大,B/A、YD和现今水合物稳定带最大厚度分别为379.5 m、336 m和351 m。B/A、YD平均厚度分别为295 m和234 m。B/A、YD时期水合物稳定带出现的水深分别为475 m和670 m。忽略地形变化,水合物稳定带分布面积分别约为4.69 × 10⁴ km2和4.04 × 10⁴ km2。
3.3 温压条件对GHSZ的影响
水体温度和海平面变化常常具有同向变化的趋势特征。比如,水体温度升高时,往往伴随着海平面的上升,从而部分抵消了底水温度上升带来的影响。不同水深处,GHSZ厚度对温度和压力条件变化的敏感程度不同。这使得不同水深处影响GHSZ厚度变化的主要因素存在差异。例如,MIENERT等[33]认为新仙女木事件末期,挪威外海上陆坡区域水合物稳定带厚度主要受到底水温度上升的影响,厚度相应减薄;而下陆坡区域受到海平面升高的影响,水合物稳定带反而增厚。
为了判断水合物稳定带厚度变化的控制因素,采用单因素分析法计算当海底温度下降1℃、2℃和海平面下降125 m时不同水深站位处GHSZ厚度的变化情况。假定海底温度不变,地温梯度采用实际值(所取数据点地温梯度在60 ~ 76℃/km之间,图7a和图7b),当海平面下降最大幅度125 m时,GHSZ厚度平均减薄量仅为10.16 m(图7c和图7d)。在中层水水深范围内,当海平面下降125 m时,稳定带厚度平均减薄量从40.71 m降低到20.91 m,而在深层水水深范围内,海平面下降125 m时,稳定带厚度平均减薄量在4.18 ~ 19.08 m之间,且3 000 m以上水深处,GHSZ厚度减薄量在4.18 ~ 5.1 m之间呈窄幅度波动。当海平面不变,海底温度下降1℃时,GHSZ厚度平均增厚值为15.88 m,且不同水深处海底温度上升1℃ 所引起的水合物厚度变化值差异相对较小。在接近中层水和深层水分界的1 350 m处,海平面下降125 m与海底温度下降1℃所引起的GHSZ改变量等效,两者对GHSZ的影响互相抵消(图7d)。当海底温度下降2℃时,GHSZ厚度平均增厚值为31.74 m,最小值也有27.25 m,显著大于海平面变化带来的GHSZ厚度减薄量(图7d)。由此可见,温压条件改变对不同水层内GHSZ的影响不同。在由陆缘向中央海盆方向逐渐增大的地温梯度背景下,不同水深范围内海底温度和海平面变化对GHSZ厚度的影响存在差异,即在中层水范围内大于深层水;而且水柱引起的压力效应在中层水深度范围内相对较大,深层水范围内海平面变化对GHSZ的影响十分有限。
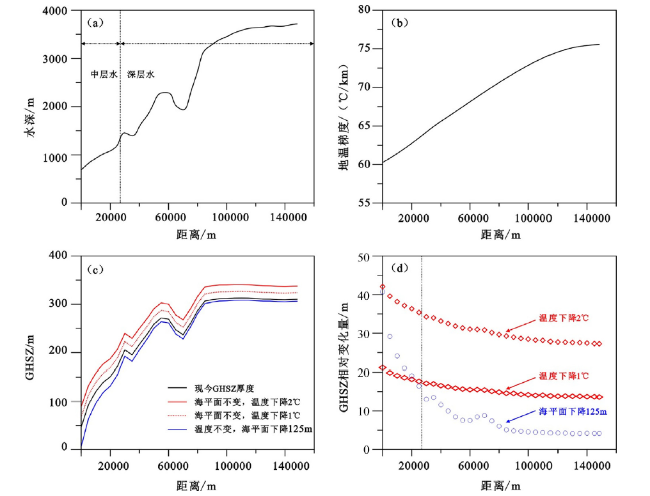
Fig. 7 The influence of temperature and pressure on the thickness of GHSZ in deep water area of Pearl River Mouth Basin图7 珠江口盆地深水区温压条件变化对水合物稳定带厚度的影响 [位置见图1b;剖面第一个点的坐标为(116.683°E,20.199°N),以后每隔5 km取一个数据点,共计31个数据点]:(a)剖面上现今的水深;(b)剖面上现今的地温梯度;(c)现今的GHSZ厚度和海平面或海底温度相对现今变化后的厚度;(d)蓝色线表示海底温度不变,海平面相对现今下降125 m后GHSZ的厚度与现今GHSZ的厚度之差,红色线表示海平面不变,温度分别下降1℃(虚线)和2℃(实线)后GHSZ厚度与现今GHSZ的厚度之差 |
在定量分析海底温度变化对GHSZ厚度的影响时,假设珠江口盆地深水区中层水和深层水间温度同步变化且变化幅度相同。而实际上,在冰期-间冰期旋回过程中不同水层间温度变化幅度和相位很可能存在差异。前人的研究表明,末次盛冰期以来表层水温度上升最大幅度值约为5 ~ 6℃[34];中层水温度上升的最大幅度在2℃以上[35]。而深层水变化幅度小于中层水,仅存在1 ~ 1.5℃的波动[36,37]。综上所述,25 ka以来中层水海底温度上升所引起的GHSZ的减薄效应,大部分时间段可以完全抵消海平面上升对GHSZ的增厚效应。海底温度变化是控制研究区天然气水合物稳定带厚度的主要因素。只有当海底温度上升幅度较小如低于1℃时,在较浅的水深范围内,海平面变化引起的压力效应才大于温度变化对水合物稳定带厚度的影响(图7d)。
3.4 水合物分解的环境效应
B/A暖期向YD冷期过渡中,由于底水变暖导致GHSZ底界向上迁移,GHSZ底部附近形成的水合物层段发生分解。假设含天然气水合物沉积物的平均孔隙度取45%,沉积物孔隙中天然气水合物的饱和度取1.2%,气体体积膨胀因子取160,采用体积法估算B/A时期水合物所含甲烷资源量约为标准状态下的1.2 × 1013 m3,YD时期水合物所含甲烷资源量为0.82 × 10¹³ m3。B/A暖期向YD冷期过渡中水合物分解释放的甲烷量约0.38 × 1013 m3,折算成总碳量约为1.9 Gt。
高分辨率多道地震反射数据显示,分解形成的甲烷气体部分释放到海洋中形成羽状流。羽状流在距离海面525 ~ 750 m时消失,与之对应地层的震测剖面显示在海底处出现麻坑、气体溢出口等与甲烷渗漏相关的地形地貌特征[38]。进入海水后,甲烷气将被氧化形成二氧化碳,可能会导致海水酸度降低和碳酸盐岩溶跃面变浅,造成一系列的生态环境影响。珠江口盆地深水区的多个站位在新仙女木时期CaCO3含量记录均呈现“快速降低,缓慢升高”的特征。ZHS-176站位水合物稳定带厚度在12.9 ~ 11.6 ka BP期间由241 m减薄为182 m,相对减薄幅度达到24.5%;与此相对应,CaCO3含量从24%降至16%,平均降幅为9%,相对降幅高达40%。这一“低钙事件”很可能是该区天然气水合物稳定带减薄造成水合物失稳引起的环境效应。另一方面,部分甲烷气由于水合物的遮挡作用,将聚集在GHSZ底部之下,形成一定高度的气柱。如果这个气柱聚集达到临界高度,先存的断层可能被地层压力重新激活,引发大规模的海底滑坡或塌陷。珠江口盆地滑塌构造发育,但单个滑塌体规模不大,同时代表水合物底界面的BSR多位于滑塌体内或与滑移面重合,呈不连续或突变状[39]。这表明珠江口盆地滑塌体的存在与天然气水合物的形成和分解具有紧密的联系。
4 结论
(1)珠江口盆地水深超过600 m的海域具备形成天然气水合物的温压条件;水合物稳定带厚度的加权平均值为245 m。研究区西北部稳定带的厚度最大,最大厚度超过330 m。25 ka以来神狐海域天然气水合物稳定带厚度呈现一定的旋回变化的特征;末次冰期GHSZ厚度大于全新世,且在YD末期处厚度最小。B/A暖期向YD冷期过渡中水合物分解释放的甲烷量约0.38 × 1013 m3,折算成总碳量约为1.9 Gt。
(2)在由陆缘向海盆方向逐渐增大的高地温梯度背景下,25 ka以来珠江口盆地深水区海底温度和海平面变化对GHSZ的影响在中层水范围内大于深层水;同时水柱引起的压力效应在中层水深度范围内相对较大,深层水范围内十分有限。珠江口海域新仙女木时期水合物分解可能引起了一系列的环境效应,如海水酸化等。
