

0 引言
盐酸是一种重要的化工产品和酸洗剂,不仅可用于化学分析、制备无机化合物和有机化合物以及离子交换树脂的再生,还可用于金属表面的酸洗[1]。在钢材的酸洗工艺中,金属表面氧化层与浓盐酸发生剧烈的化学反应,以达到除去表面氧化层的目的。随着酸洗工艺的进行,盐酸的浓度会越来越低,当达到一定的低值,为了不影响酸洗效率,需要更换高浓度的酸液。因此,钢材酸洗过程会排放大量低浓度的含铁废盐酸。由于含铁废盐酸具有强腐蚀性、毒性和污染性,必须经过进一步综合处理或者回收再利用,直接排放会造成严重的环境污染。
针对低浓度废盐酸的大规模连续回收利用,国内外比较成熟的处理工艺有常规解析法、变压精馏法和萃取精馏法。通过精馏,实现稀酸浓缩,重新返回生产工艺,是废酸资源化利用最好的办法。通常情况下,盐酸溶液体系会形成最高共沸物,共沸物中HCl的质量分数为20.2%,此时该二元体系的共沸点是108.6℃[4]。因此,低浓度的废盐酸溶液可以通过普通精馏的方式得到接近HCl-H2O共沸组分浓度的盐酸。张颖等[5]对HCl-H2O-MgCl2体系气液平衡进行了实验研究,考察了不同MgCl2质量浓度对HCl-H2O体系气液平衡的影响以及对塔顶盐酸浓度的影响;同时,张颖等[6]考察了不同氯盐(MgCl2、CaCl2、NaCl、KCl)对HCl-H2O体系相对挥发度的影响,在相同盐浓度的条件下,盐效应的能力大小为MgCl2>CaCl2>NaCl>KCl。刘伟明等[7]对塔釜加盐解吸-塔顶吸收组合过程进行了实验研究,考察了不同盐浓度、塔釜加料量、吸收剂流率以及塔釜温度等参数对吸收液浓度、塔釜解吸液浓度及HCl回收率的影响。张荣臻等[8,9]提出了加盐蒸馏-铁系混凝剂制备组合工艺,用于盐酸的可再生利用和铁盐的综合利用,考察了不同氯盐(KCl、NaCl、MgCl2、CaCl2、FeCl2、FeCl3)对盐酸蒸馏的影响以及蒸馏操作条件对蒸馏母液制备聚铁混凝剂的影响。吴振玉等[10]对加盐解吸-气体吸收-加盐精馏组合工艺进行了实验研究,考察了不同的塔釜加盐量、塔釜解吸液、吸收剂流率对耦合过程的影响。
本文针对低浓度废盐酸的回收再利用问题,借助搭建的精馏塔实验平台,研究了不同时间下塔釜、塔顶温度场和浓度场的分布情况,以及不同的初始溶液浓度和回流比等操作参数对该间歇精馏过程的影响,并进一步对该系统进行有效能分析和分析该系统能量损失的主要原因。本文旨在探索一种投资成本低、技术简单、酸液回收率高的酸洗废液资源化处理技术,为中小型企业酸洗废液的处理提供一种切实可行的技术工艺,降低相关企业酸洗废液的处理成本。
1 实验装置
1.1 技术原理及工艺流程
精馏是化工生产中重要的关键环节,是液体混合物分离提纯的重要手段。间歇精馏技术的基本原理是将液体混合物物料分批加入精馏塔的塔釜中,在一定的热力学条件下,借助精馏塔的气液两相回流和逆向多级接触以及多次平衡汽化-冷凝的相变作用,塔顶冷凝液中浓集了物料中的易挥发组分,而塔釜溶液中浓集了物料中的难挥发组分,使液体混合物依据各组分挥发度的差异性达到较完全分离、产品收率较高的单元操作,以满足其工艺要求。低浓度废盐酸可以通过精馏操作得到较高浓度的稀盐酸(18%左右),再与浓盐酸(35%)混合继续用于钢材的酸洗过程,从而达到回收利用的目的,实现废酸的资源化利用以及零排放[11,12]。该系统将酸洗废液过滤的低浓度废盐酸(含少量铁离子)作为原料,通过精馏法浓缩废盐酸溶液达到较高的浓度,关键操作工艺是精馏参数的设定和调节。因此,本文主要分析研究盐酸和水分离过程中相对挥发度和气液相平衡关系,在精馏塔内部同时进行复杂的传热-传质过程,使易挥发组分不断从液相往气相中转移,难挥发组分不断从气相向液相中转移,以及回流作用达到多次部分汽化和部分冷凝的效果,使二元体系混合物得到部分分离的过程。
低浓度废盐酸间歇精馏工艺流程如图1所示,该工艺流程所涉及的装置包括精馏塔塔身、冷凝器、回流罐、储水罐、蒸汽发生器和塔釜(类似于再沸器),以及节流阀和泵等设备[12]。配制的低浓度稀盐酸通过进料口一次性输送至塔釜底部,储水罐中的自来水由出口1被泵进蒸汽发生器,蒸汽发生器产生0.5 Mpa的水蒸气通过进料口3(3根毛细管)进入到塔釜底部(毛细管盘绕在塔釜底部,与塔釜溶液充分接触),为塔釜提供蒸发所需的热量,换热过后的低压低温热水通过出料4排出;当塔釜溶液温度达到蒸发所需的温度,液体混合物开始以气相物态从下到上依次经过各填料层进行气液两相传热-传质过程,最终蒸发气体进入螺旋管冷凝器。在冷却水作用下发生冷凝作用,回流罐收集到的冷凝液有一部分进行回流,参与精馏塔内部的气液两相的传热-传质过程,从而达到浓缩低浓度稀盐酸的作用。该精馏过程发生多次部分汽化和冷凝作用,以及在特定高度的精馏同时作用下,实现了低浓度废盐酸回收利用的目的。本文工艺流程除了可以实现废盐酸再生利用,也有利于降低企业的投资成本。如青岛福顺环保设备有限公司以石墨化工设备为主体,采用蒸发浓缩工艺对废酸水进行处理,将盐酸浓缩到15% ~ 18%,使用的一整套石墨化工设备投资成本约85万元,投资成本较高。采用本文精馏法浓缩稀盐酸,达到与该企业相同的废酸处理规模,投资成本为15 ~ 20万元,大大地降低了企业的投资成本。
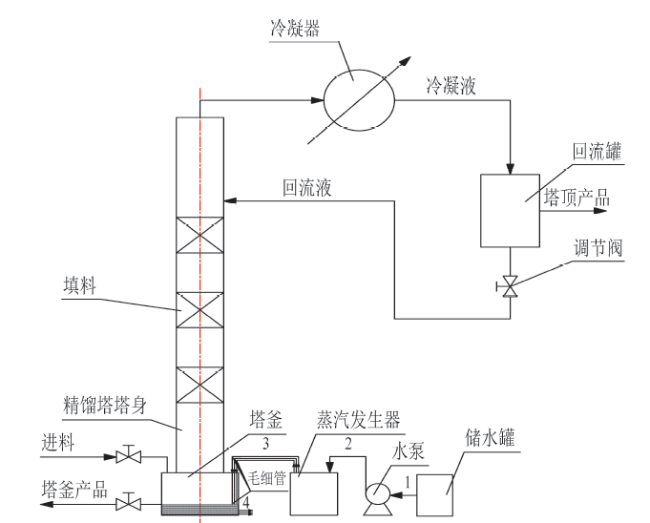
Fig. 1 Process flowchart of batch distillation of low-concentration waste hydrochloric acid图1 低浓度废盐酸间歇精馏工艺流程图 |
1.2 主要设备与测量仪表特征
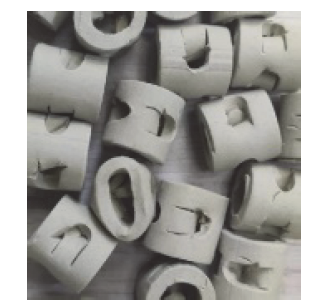
Fig. 2 Pall ring ceramic filler图2 鲍尔环陶瓷填料 |
Table 1 Technical parameters of low concentration waste hydrochloric acid distillation表1 低浓度废盐酸精馏塔技术参数 |
| 参数 | 尺寸 |
|---|---|
| 精馏塔高度 | 18 m |
| PPR管 | DN 50 mm |
| 鲍尔环填料 | Φ 16 mm × 16 mm × 3 mm (空隙率 0.7,比表面积240 m2/m3) |
| 冷凝器 | Φ25 mm/Φ20 mm(螺旋管式冷凝器) |
| 保温层厚度 | 20 mm |
| 精馏塔塔釜 | Φ250 mm × 800 mm |
本研究的间歇精馏塔装置一般是单塔运行,只有精馏段,无提馏段。利用高温水蒸气给塔釜加热,系统在2.5 h达到稳定运行的状态,回流液开始返回精馏塔内部,实现精馏塔气液两相间传热-传质的过程。在间歇精馏操作过程中,塔内各项气液组成及温度等参数随时间而改变。间歇精馏是一个典型的非稳态操作过程,回流比是一个常用的调节参数。对于该间歇精馏系统,通过改变回流比等参数可以达到塔釜产品预期的要求。实验过程中,采用K型热电偶测温仪(测温精度 ±2℃)测定塔釜、塔顶的温度变化,25 mL碱式滴定管(配合精密pH试纸)测定塔釜、塔顶的浓度变化和液相组成,气相色谱仪测定塔顶气相组成,并记录数据。
2 实验结果与讨论
2.1 相对挥发度
$\alpha =\frac{{{v}_{\text{A}}}}{{{v}_{\text{B}}}}=\frac{{{y}_{\text{A}}}{{x}_{\text{B}}}}{{{y}_{\text{B}}}{{x}_{\text{A}}}}$ (1)
${{x}_{\text{A}}}=\frac{{{n}_{\text{A}}}}{{{n}_{\text{A}}}+{{n}_{\text{B}}}}$ (2)
${{x}_{\text{B}}}=\frac{{{n}_{\text{B}}}}{{{n}_{\text{A}}}+{{n}_{\text{B}}}}$ (3)
式中:vA、vB —盐酸溶液中HCl、H2O的挥发度;yA、yB—气相中组分HCl、H2O的摩尔分数;xA、xB—液相中组分HCl、H2O的摩尔分数;nA、nB—盐酸溶液中HCl、H2O物质的量,mol。
如表2所示,通过对该精馏塔塔釜与塔顶气液两相组分的测定,可以计算出HCl-H2O体系中盐酸对水的相对挥发度在0.106 6 ~ 0.134 0之间。废盐酸在低浓度范围内(3% ~ 7%)达到相平衡状态时盐酸对水的相对挥发度几乎不发生变化,这有利于塔釜低浓度废盐酸浓缩达到较高的浓度。
Table 2 Measured value of relative volatility for the HCl-H2O system表2 HCl-H2O体系相对挥发度的测定值 |
| 盐酸质量分数 / % | 相对挥发度 |
|---|---|
| 3 | 0.116 0 |
| 5 | 0.115 0 |
| 7 | 0.109 1 |
2.2 气液相平衡
Table 3 Vapor-liquid phase equilibrium experimental data of hydrochloric acid and water system表3 HCl-H2O体系气液相平衡实验数据 |
| 温度 / ℃ | xA | yA |
|---|---|---|
| 100.4 | 0.052 | 0.006 |
| 101.7 | 0.064 | 0.008 |
| 103.5 | 0.072 | 0.009 |
| 104.3 | 0.083 | 0.016 |
| 105.2 | 0.090 | 0.045 |
| 107.1 | 0.100 | 0.075 |
| 108.4 | 0.115 | 0.145 |
| 108.7 | 0.125 | 0.168 |
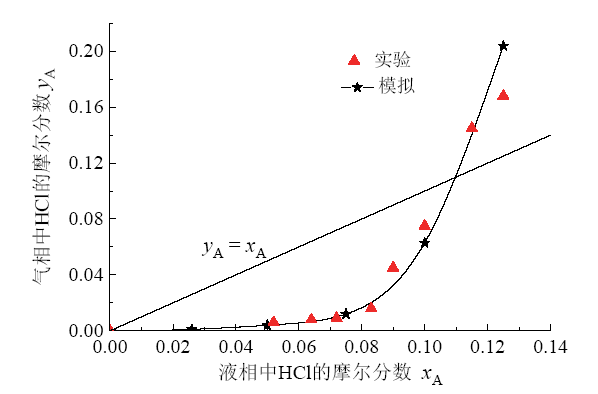
Fig. 3 Vapor-liquid phase equilibrium diagram of hydrochloric acid and water system图3 HCl-H2O体系气液平衡相图 |
2.3 温度场和浓度场
实验分别采用圆形陶瓷小球填料和鲍尔环陶瓷填料,鲍尔环陶瓷填料能使系统达到精馏分离要求。相对于圆形陶瓷小球填料层,鲍尔环陶瓷填料层具有空隙率高、比表面积大等特点,以至于气、液接触面大,传热系数高,同时通量大而阻力小,这样有利于精馏塔内部气液两相间的传热-传质过程。因此,实验过程中采用鲍尔环陶瓷填料测定了酸洗废液在初始浓度为3%、5%和7%(质量分数)条件下,精馏塔塔釜和塔顶温度随时间的变化情况,如图4所示,在低浓度范围内,精馏塔塔釜和塔顶的温度变化规律几乎不受稀盐酸浓度的影响。该系统在蒸汽加热的情况下,经过2.5 h达到稳定运行状态,塔釜和塔顶的温度分别维持在115 ~ 125℃和95 ~ 100℃。
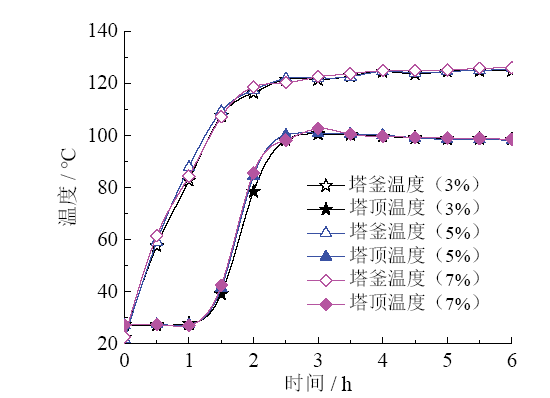
Fig. 4 Changes of the bottom and the top temperature with time under different concentrations图4 不同浓度下塔釜和塔顶温度随时间的变化情况 |
图5为不同回流比下塔釜产品质量分数变化,可以看出,质量分数为5%的塔釜溶液基于热能驱动达到稳定运行的状态。随着时间的推移,塔釜盐酸溶液质量分数呈现出变大的趋势,直到保持在18%左右且塔顶产品在0 ~ 60 min内几乎为水,随后塔顶产品pH值保持在5 ~ 6之间。在不同回流比作用下,塔釜产品质量分数和塔顶产品pH值变化趋势基本一致,此外,回流比越大,质量分数达到平衡所需的时间越短,该装置塔釜盐酸溶液浓度最高可以达到18.2%,接近盐酸溶液共沸组成20.2%。因此,采用间隙精馏技术可以实现回收利用低浓度稀盐酸溶液。
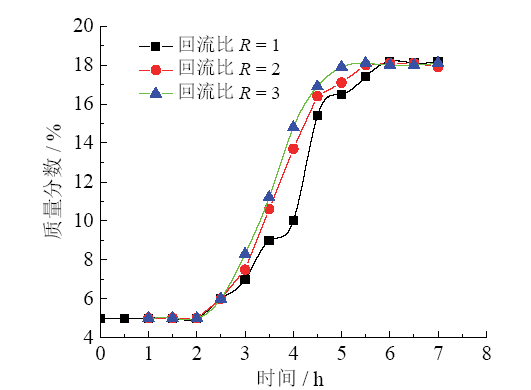
Fig. 5 Changes of the bottom product mass fraction with time under different reflux ratio图5 不同回流比下塔釜产品质量分数随时间的变化情况 |
2.4 有效能分析
对于稳态流动过程,物流的物理有效能(Ep)为:
${{E}_{\text{P}}}=H-{{H}_{0}}-{{T}_{0}}\left( S-{{S}_{0}} \right)$ (4)
式中:H和S分别为物流处于某一状态的焓和熵;H0和S0分别为物流在基准态时的焓和熵;基准态取P0 = 101.325 kPa。
恒温物流的有效能为:
${{E}_{\text{p}}}=Q\left( 1-{{{T}_{0}}}/{T}\; \right)$ (5)
变温物流的有效能为:
${{E}_{\text{p}}}=Q\left( 1-{{{T}_{0}}}/{{{T}_{\text{m}}}}\; \right)$ (6)
式中:Q为热量;Tm为热力学平均温度,${{T}_{\text{m}}}=$ $\left( {{T}_{2}}-{{T}_{1}} \right)\ln \left( {{{T}_{2}}}/{{{T}_{1}}}\; \right)$;T1、T2分别为物流的初始和最终温度。
有效能衡算方程为:
${{E}_{\text{pi}}}={{E}_{\text{po}}}+{{E}_{\text{pl}}}$ (7)
式中:Epi、Epo、Epl分别为输入、输出和损失的有效能。
有效能效率η为:
$\eta =\frac{{{E}_{\text{po}}}}{{{E}_{\text{pi}}}}\times 100%$ (8)
为了让间歇精馏塔塔釜产品中盐酸的质量分数能达到18.2%,通过蒸汽发生器给塔釜充分供热。低浓度稀盐酸精馏塔的有效能分析如表4所示,其中,低浓度稀盐酸精馏塔有效能效率为43.94%。低浓度稀盐酸精馏塔整个系统能量损失的主要原因有:(1)精馏塔塔体高度达到18 m,整个系统散热损失大;(2)经过冷凝器的冷却水使塔顶溶液冷凝带走一部分热量。 该系统可以通过适当增加塔体保温层减小塔体散热损失,以及降低加热介质温度或提高冷却介质等来提高有效能效率。
Table 4 The exergy analysis of distillation column表4 精馏塔装置的有效能分析 |
| 项目 | 流量 / (kg/h) | 压力 / MPa | 温度 / ℃ | 有效能 / (kJ/h) |
|---|---|---|---|---|
| 进料 | 20.0 | 常压 | 21.8 | 79.63 |
| 蒸汽发生器 | / | 0.5 | 158.0 | 23 373.00 |
| 总输入 | / | / | / | 23 452.63 |
| 塔顶出料 | 5.1 | 常压 | 57.2 | 430.33 |
| 塔底出料 | 12.7 | 常压 | 108.0 | 9 875.47 |
| 总输出 | / | / | / | 10 305.80 |
| 冷凝器损失 | / | / | / | 1 603.50 |
| 其余热损失 | / | / | / | 11 543.33 |
| 有效能效率η | / | / | / | 43.94% |
3 结论
针对酸洗过程中产生的低浓度废盐酸问题,提出了间歇式精馏法浓缩稀盐酸系统。通过对系统塔釜、塔顶温度场和浓度场的测定,对该系统进行了有效能分析。研究结果表明:
(1)低浓度稀盐酸在热能驱动作用下达到HCl- H2O溶液体系相平衡状态,盐酸对水的相对挥发度在0.1066 ~ 0.1340之间。较小的挥发度有利于塔釜水溶液的挥发,这样便能达到浓缩低浓度稀盐酸的目的。
(2)废酸溶液进行过滤净化处理,质量分数为3% ~ 7%的稀盐酸溶液加热浓缩,塔釜质量分数可以达到18.2%。该系统有效能的效率为43.94%,需要进一步优化实验装置,提高能源利用率。
(3)提供了一种投资成本低、技术简单、酸液回收率高的酸洗废液精馏法处理技术,为中、小型企业酸洗废液的处理提供一种切实可行的技术工艺,以降低相关企业酸洗废液的处理成本。
