


开放科学(资源服务)标识码(OSID)
0 研究背景
常规光伏组件只有正面发电,背面不发电,当光伏方阵周边存在地面的反射光和大气的散射光时,这部分的辐射就不能很好地被利用起来,发电效率受限。伴随平价上网时代的来临和“领跑者”项目技术指标的要求,双面光伏组件这一技术创新得到了越来越多的重视和应用。所谓双面光伏组件,就是组件正、背面均能接收太阳辐射并转化成电能,相对于仅单面发电的组件而言,其对实现光伏电站的降本增效、加快实现光伏发电平价上网具有重要意义。此外,因背面也要吸收光线,双面组件的正背面都可采用钢化玻璃作为封装材料,增加了组件的耐候性和可靠性,产品的应用场景较丰富,具有较好的应用前景。
目前国内外文献上对可调支架的研究仅局限于单面发电组件系统,而缺少双面组件系统的研究。因此,本文以双面光伏组件和可调支架系统为基础,利用PVsyst软件,以青海格尔木为模拟地点,分析对比不同调节次数下的组件正面和背面辐射量、系统发电量和系统收益等,为实际安装应用提供理论基础。
1 双面发电系统发电量计算公式
常规光伏组件的仿真模型一般使用简易的单二极管模型,由于双面组件背面的电池结构与正面相似,发电特性也可以用单二极管模型模拟,因此背面的辐射量可以线性叠加到正面[8]。组件正面接收太阳辐射以后,组件正面实际可被利用的辐射量需要考虑近场阴影遮挡、远方遮挡、相对透射率损失、积灰损失以及地面反射光的增益。到达地面的辐射被地面反射以后有部分到达组件背面,考虑组件背面的遮挡因素,实际被背面利用的辐射还需要乘以双面组件的发电系数。因此双面系统发电量公式可以表述为式(1):
${\mathop{\rm E}\nolimits} {\rm{ = }}{{\mathop{\rm P}\nolimits} _{}}\left[ {{{\mathop{\rm G}\nolimits} _{{\rm{inc}}}}\left( {{\rm{1}} - {{\mathop{\rm G}\nolimits} _{{\rm{loss}}}}} \right){\rm{ + }}{f_{\rm{b}}} \cdot {{\mathop{\rm G}\nolimits} _{{\rm{b\_eff}}}}} \right]\left( {1 - \eta } \right)$ (1)
式中:E—发电量,kW∙h;P—系统装机容量(一般以组件正面的标称功率为准),kW;Ginc—光伏组件正面的辐射量,kW∙h/m2;Gloss—正面辐射损失系数,%;fb—双面发电系数(bifacial factor),为背面额定输出功率与正面额定输出功率的比值,%;Gb_eff—背面的有效辐射量,kW∙h/m2;η—其他损失(包括方阵其他损耗、设备损耗、交流损耗、不可利用率等),%。
${F_{{A_1} \to {A_2}}}{\rm{ = }}\frac{1}{{{A_1}}}\int\limits_{{A_1}} {\int\limits_{{A_2}} {\frac{{{\rm{cos}}\theta {}_1{\rm{cos}}{\theta _2}}}{{{\rm{\pi }}{{\mathop{\rm s}\nolimits} ^2}}}{\rm{d}}{A_1}{\rm{d}}{A_2}} }$ (2)
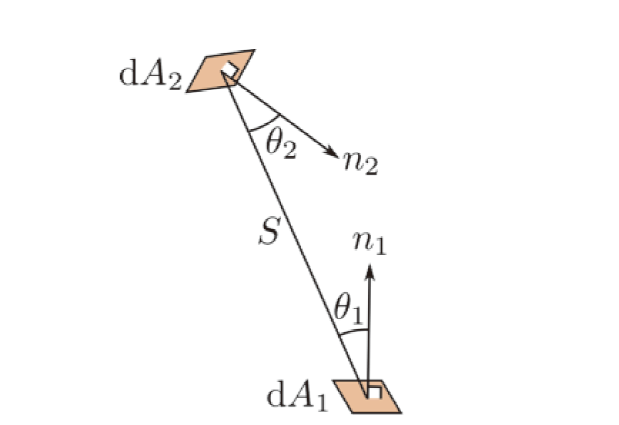
Fig. 1 Diagram of view factor mode图1 视角系数模型示意图 |
式中:s—微元面dA1中心到dA2中心的距离,m;θ1—A1法线n1与A1A2连线的夹角,°;θ2—A2法线n2与A1A2连线的夹角,°。
2 可调倾角双面发电系统的研究方法
文中主要基于PVsyst软件进行仿真,该软件使用单二极管模型,对双面组件的模型建立较为全面和准确,是行业内公认的专业光伏仿真软件。具体研究方法如下:
(1)选择仿真地点,获取典型气象年的月份辐射量数据。
(2)确定可调支架的调节范围,目前支架可以支持的角度范围为10° ~ 60°。
(3)确定光伏方阵的前后安装距离,可根据土地面积,确定合适的安装间距。
(4)设定双面组件的发电参数,根据仿真软件得到固定支架方式下发电量最大时的角度及发电量数据,用于后续方案比较与选择的参考。
(5)调节组件的安装倾角,步长1°,从10°到60°,由于角度发生变化,组件最低点离地面高度发生变化,需要进行计算,在其余参数不变的情况下,51个角度各仿真1次,并得到每个月的组件正面、背面辐射值和系统发电量数据。
(6)确定一年角度调节次数和不同调节次数下的最优月份组合。调节次数一般为每年12次、4次、3次、2次。调节次数一定时,以自然月为基础,一年12个月组合产生不同的发电量结果,再以发电量最大为原则,找到最优的月份组合,即为某调节次数下的最优调节方案。
(7)不同的调节方案在全生命周期25年的发电量、人工调节费用不同,使用差额净现值为衡量指标进行比较,确定最佳的调节方案。
3 安装倾角对发电量的影响
选取青海格尔木市为模拟地点,该地区年平均水平辐射量为6 967.4 MJ/m2,数据来自Meteonorm 7.2气象软件。以一个逆变器单元进行仿真,逆变器为500 kW集中式逆变器,组件选用275 W单晶组件,双面发电系数为0.85,20块串联,共96个组串,组件容量为528 kW。组件按双排纵向安装,地面场景反射率为30%。
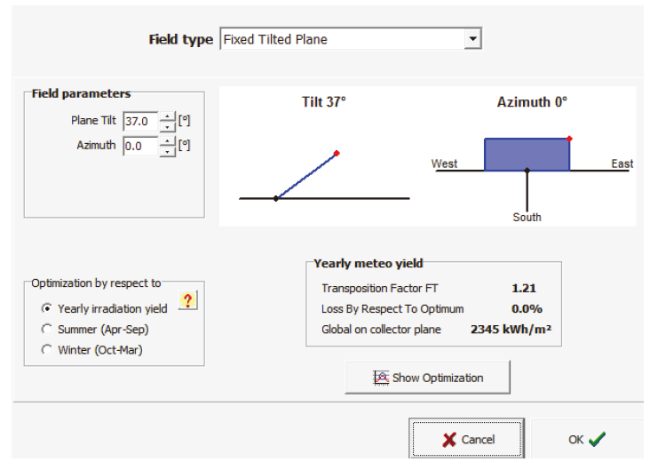
Fig. 2 Calculation results of inclination angle of maximum annual irradiation图2 全年正面辐射量最大时的倾角计算结果 |
以冬至日9:00-15:00无阴影遮挡为基准,计算得到的组件前后排最佳间距为7.63 m。辐射量最大时的角度其全年发电量不一定为最大,因角度越大,早晚时方阵前后遮挡会增加,虽然适当降低角度可以减少遮挡,但同时组件表面的辐射量也会相应减少,为了得到双面系统年发电量最大的安装角度,需要模拟不同角度对应的发电量进行综合比较。
如图3为广泛使用的圆弧式可调支架实景图和侧面示意图,一般光伏组件为纵向双排安装,假设地面是水平的,组件与地面的夹角为θ,组件最低点离地面高度为H1,支架支撑柱与组件的交接点离地面高度为H0,当支架安装以后,该值即为常数,这里假设是2.385 m。双排组件含两者间距的总长度为L,这里是3.34 m,根据三角函数可得到四者的关系,如式(3)所示。
${H_1} = {H_0} - \frac{L}{2}{\rm{sin}}\theta $ (3)
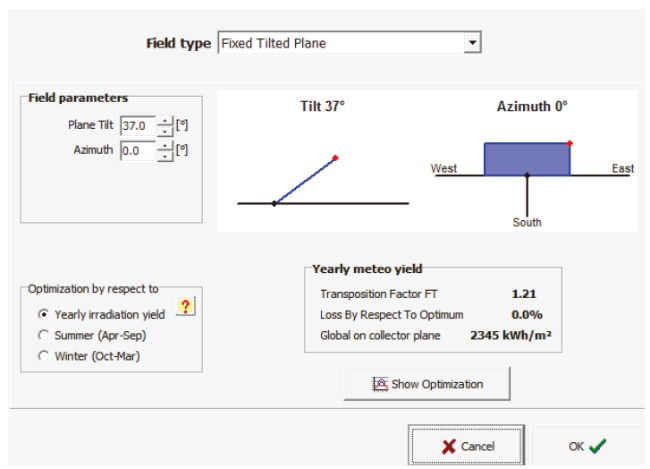
Fig. 3 (a) Picture of arc adjustable bracket; (b) side sketch of arc adjustable bracket图3 (a)圆弧式可调支架实景;(b)圆弧式可调支架侧面示意图 |
当组件的角度在10° ~ 60°变化时,组件最低点离地面的高度H1是逐渐降低的。例如角度为10°时,H1为2.09 m,角度为60°时,H1降低为0.94 m。
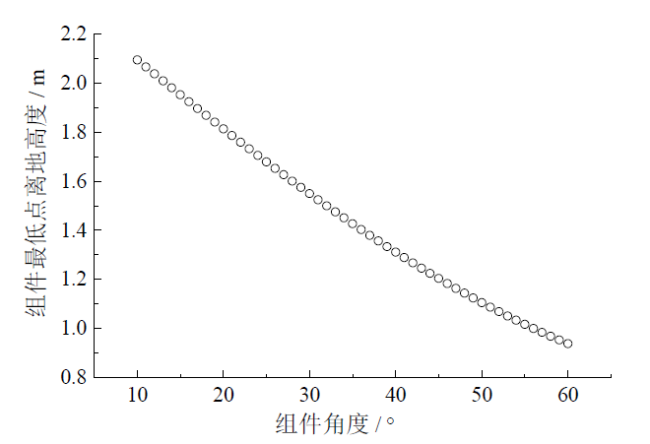
Fig. 4 Relationship between the minimum height of PV module and its angle图4 可调支架系统组件最低点离地高度与组件角度的关系 |
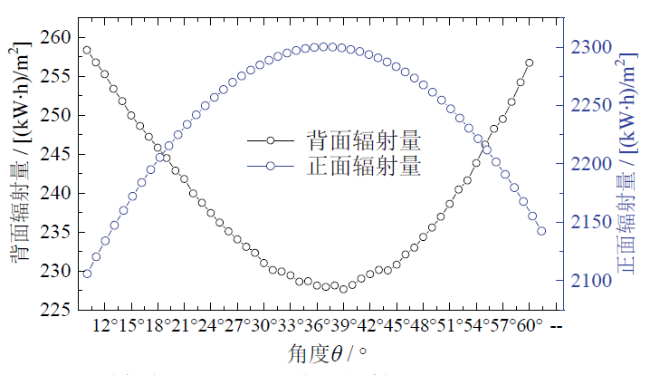
Fig. 5 Irradiation comparison of front side and rear side at different angle图5 不同角度下的正面和背面辐射量对比 |
图6为不同角度的系统全年发电量曲线,对于固定支架方式,当组件角度为32°不变时,对应系统的全年发电量最大。超过该角度后,全年的发电量呈现下降趋势。
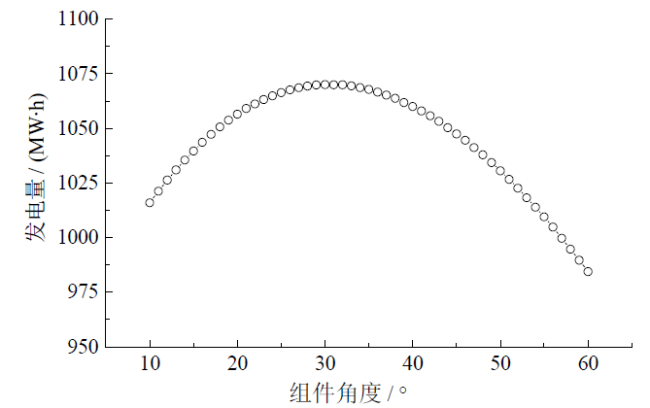
Fig. 6 Relationship between annual energy yield and angle图6 不同倾角对应的年发电量变化 |
以全年发电量最大得到的固定安装角度,其每个月的发电量并不一定达到最大。这是由于一年四季太阳的高度角在发生变化,一般冬季较低,夏季较高。当太阳的高度角越大,组件的安装倾角应适度调低,这样才能接收到最大的辐射量,实现较高的发电量。
图7为不同月份发电量最大时对应的组件角度,比如1月份时,安装角度在57°时发电量最大,到了5月、6月和7月,发电量最大时的角度为10°。
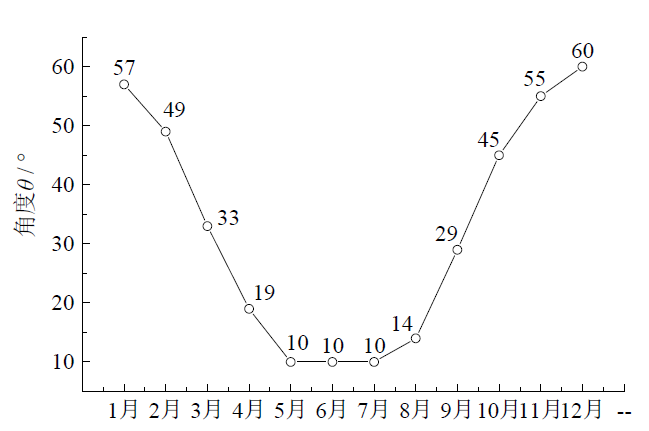
Fig. 7 Installation angle of PV module at maximum energy yield in each month图7 月份发电量最大时对应的组件最佳倾角 |
如果采用可调支架,夏季调低角度,冬季调高,得益于角度变化后,组件表面获取的辐射量增加,发电量就会提升。由于可调支架的年调节次数是可变的,即使一年调节4次,也存在不同的月份组合方式,因此需要以发电量最大为原则来确定每个月的组件安装角度。
4 安装间距对发电量的影响
光伏组件安装时的前后距离不同,占地面积就会不同,光伏方阵的土地利用率(ground coverage ratio, GCR)为光伏阵列的宽度与方阵前后距离的比值,前后间距越大,GCR越小。
当光伏方阵安装角度不变时,调节固定支架方阵的前后距离,可仿真得到该变量对发电量的影响。以固定支架为例,当GCR从0.46到0.322逐渐减少时,入射到地面的直接辐射增加后,被地面反射到达背面的辐射也因此增加。当支架角度为可调节时,GCR越小,对于4种调节方案,其背面的辐射量也逐步增加,背面的发电量也得到一定的提升,如图8所示。
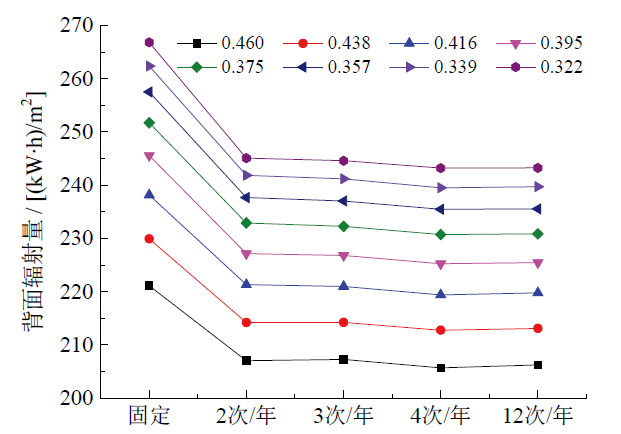
Fig. 8 Rear side irradiation comparison with different GCR for different adjustment times图8 不同调节次数下GCR变化时的背面辐射总量对比 |
当阵列的前后距离增加时,对于正面发电而言,前后排遮挡损失减少,因此正面的发电量增加。综合而言,双面组件的整体发电量得到了一定的提升,如图9所示。鉴于双面组件安装角度和前后距离对发电量均产生影响,在设计环节,优化安装角度的同时还需要考虑现场的土地可利用面积。
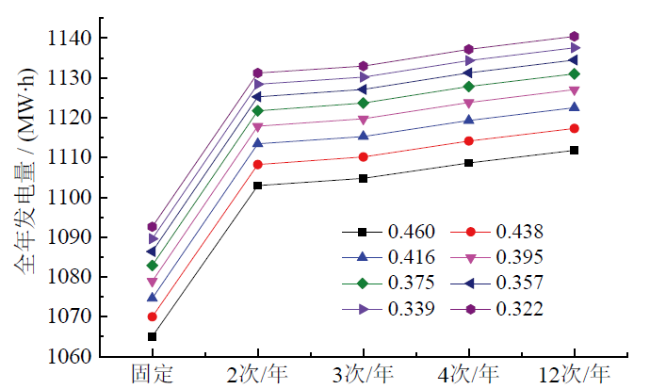
Fig. 9 Energy yield comparison with different GCR for different adjustment times图9 不同调节次数下GCR变化时的全年发电量对比 |
5 可调方案设计
为了确定可调支架带来的发电量提升效果以及可调支架最优的调节次数,如前文所述,固定支架方式的安装角度选择32°,前后间距以冬至日9:00-15:00无阴影遮挡为基准,组件前后排最佳间距为7.63 m。为了保证参数的一致性,可调支架的间距也保持一致。为了对比不同调节次数下的背面辐射量变化,假定地面场景反射率均为30%,组件下端离地高度随组件调节角度而变化,组件的双面发电系数为0.85。
可调支架的调节次数有一年2次、3次、4次和12次,对于一年调节12次的方案,根据图7各月发电量最大时的组件角度,冬季组件倾角范围可设置为50° ~ 60°,夏季可设置为10° ~ 16°。
Table 1 Optimal month combination and installation angle for different adjustment times表1 不同调节次数对应的最优月份组合及最优组件角度 |
| 调节次数 | 调节月份 | 最优调节角度 / ° |
|---|---|---|
| 2次/年 | 4月 ~ 9月 | 12 |
| 10月 ~ 次年3月 | 49 | |
| 3次/年 | 3月 ~ 4月 | 26 |
| 5月 ~ 9月 | 11 | |
| 10月 ~ 次年2月 | 52 | |
| 4次/年 | 3月 ~ 4月 | 26 |
| 5月 ~ 8月 | 10 | |
| 9月 ~ 10月 | 38 | |
| 11月 ~ 次年2月 | 52 | |
| 12次/年 | 每月调1次 | 参考图7 |
6 仿真结果分析
6.1 不同调节次数的组件正面辐射量对比
Table 2 Monthly irradiation of front side for different adjustment times表2 不同调节次数对应的组件正面月度辐射量 |
| 月份 | 月度辐射量 / [(kW∙h)/m2] | ||||
|---|---|---|---|---|---|
| 固定不调 | 2次/年 | 3次/年 | 4次/年 | 12次/年 | |
| 1月 | 172.2 | 191.5 | 194.4 | 195.2 | 195.8 |
| 2月 | 171.1 | 182.7 | 183.4 | 183.4 | 182.9 |
| 3月 | 195.2 | 194.8 | 193.3 | 193.3 | 196.4 |
| 4月 | 212.9 | 211.3 | 214.0 | 214.0 | 214.0 |
| 5月 | 208.4 | 221.6 | 221.8 | 222.3 | 222.3 |
| 6月 | 194.0 | 210.8 | 211.3 | 212.4 | 212.4 |
| 7月 | 198.7 | 213.1 | 213.4 | 214.2 | 214.2 |
| 8月 | 203.7 | 208.1 | 207.9 | 206.9 | 208.4 |
| 9月 | 205.6 | 194.3 | 193.2 | 205.5 | 205.8 |
| 10月 | 202.9 | 212.2 | 211.8 | 208.1 | 211.8 |
| 11月 | 173.2 | 190.1 | 192.3 | 192.8 | 192.8 |
| 12月 | 157.0 | 177.9 | 181.4 | 182.4 | 183.9 |
| 全年 | 2 294.9 | 2 408.4 | 2 418.2 | 2 430.5 | 2 440.7 |
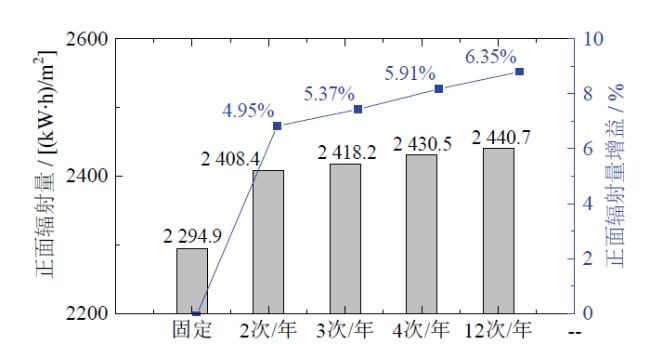
Fig. 10 Annual irradiation and gain of front-side of PV module for different adjustment times图10 不同调节次数对应的组件正面辐射总量和增益 |
与固定倾角方案相比,一年调节12次方案的组件正面辐射量有一定增益,其辐射增益结果如图11所示。可以看出,由于3、4、9这三个月份的调节角度与固定支架角度32°接近,正面辐射量几乎无增益,其余月份增益为2.31% ~ 17.13%,其中,冬季增益最大,说明固定倾角安装相比于月度可调式安装,冬季损失的辐射量较大。
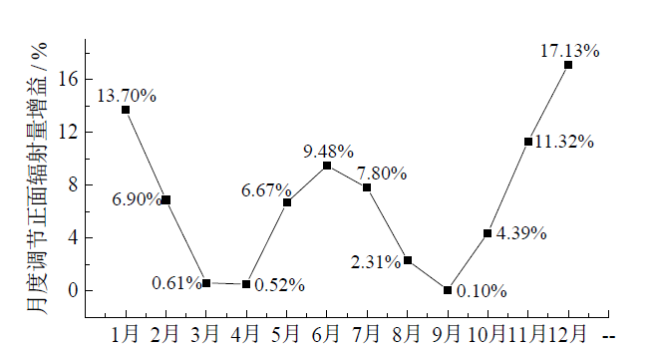
Fig. 11 Monthly irradiation gain of front-side of PV module for monthly adjustment method图11 月度调节方式对应的组件正面月度辐射量增益 |
6.2 不同调节次数的组件背面辐射量对比
组件背面辐射接收量主要包括三个方面:地表反射到组件背面的反射辐射、早晨或傍晚从天空直接接收到的散射辐射、夏天早晨背面直接接收到的直接辐射。背面辐射量的精确计算比较复杂,影响因素包括地面场景反射率、组件离地高度、组件倾角和方位角等。
表3是PVsyst软件模拟的不同调节次数下的组件背面获取的辐射量,与固定倾角相比,由于可调支架系统是考虑到正面和背面的发电量总和最高,如果某一角度对应的发电量增加,有可能是因为该角度下组件的正面发电增益超过了背面发电的减少,即可调支架系统优化后,背面的辐射可能会减少。特别是10月至次年2月,采用可调支架方式以后,背面辐射均出现一定程度的降低,但是降低的数值较小。
Table 3 Monthly irradiation of rear-side for different adjustment times表3 不同调节次数对应的组件背面月度辐射量 |
| 月份 | 辐射量 / [(kW∙h)/m2] | ||||
|---|---|---|---|---|---|
| 固定 | 2次/年 | 3次/年 | 4次/年 | 12次/年 | |
| 1月 | 10.6 | 9.8 | 10.0 | 10.2 | 10.4 |
| 2月 | 13.4 | 12.0 | 12.0 | 12.0 | 12.0 |
| 3月 | 18.8 | 18.3 | 19.5 | 19.5 | 18.4 |
| 4月 | 22.9 | 24.9 | 23.3 | 23.3 | 23.9 |
| 5月 | 27.8 | 27.8 | 27.8 | 27.8 | 27.8 |
| 6月 | 27.9 | 27.1 | 27.1 | 27.0 | 27.0 |
| 7月 | 28.3 | 27.4 | 27.4 | 27.3 | 27.3 |
| 8月 | 24.4 | 25.2 | 25.3 | 25.3 | 25.0 |
| 9月 | 19.5 | 22.6 | 22.8 | 19.0 | 19.7 |
| 10月 | 16.8 | 15.0 | 14.9 | 15.9 | 15.1 |
| 11月 | 11.7 | 10.7 | 10.8 | 10.9 | 10.9 |
| 12月 | 7.8 | 7.0 | 7.1 | 7.3 | 7.6 |
| 全年 | 229.9 | 227.9 | 227.7 | 225.5 | 225.2 |
图12为不同调节次数的可调方案与固定倾角方案的全年背面辐射量对比。与正面辐射量的变化不同的是,无论调节次数是多少次,背面辐射量都比固定倾角有所降低,降低幅度平均约为1.45%。
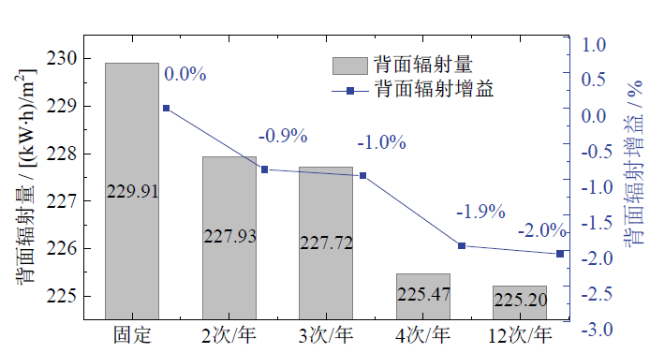
Fig. 12 Yearly irradiation and gain of rear-side for different adjustment method图12 不同调节次数对应的组件背面辐射量和背面辐射量增益 |
图13为月度调节与固定32°安装的背面辐射量对比。组件角度变化时,组件与地面的相对位置发生变化,4月的调节角度为19°,组件离地高度增加,背面辐射量增加4.66%,同理,5月和9月分别增加2.1%和1.19%。其余月份调节角度均较大,组件离地高度降低,背面辐射量均减少。而根据前文分析,到达组件背面的反射辐射及各类散射辐射与其直接投射到组件正面相比,会受到更多的削减作用。因此,保证正面获得更多的辐射量是提高系统总体发电量的优化方向。
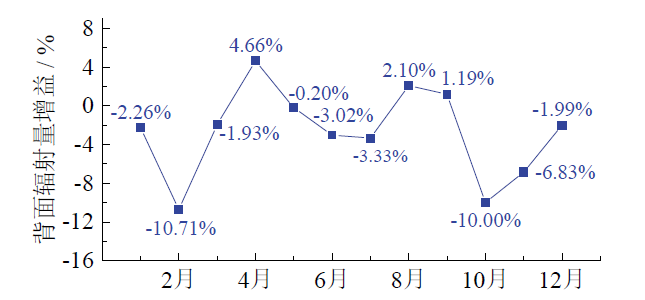
Fig. 13 Monthly irradiation gain of rear-side for monthly adjustment method图13 月度调节方式对应的组件背面辐射量增益 |
6.3 不同调节次数的双面发电系统发电量对比
Table 4 Total irradiation, energy yield and PR in the first year for different adjustment times表4 不同调节次数对应的组件整体辐射量、系统首年发电量和系统效率 |
| 调节次数 | 整体辐射量 / [(kW∙h)/m2] | 系统首年发电量 / (MW∙h) | 系统效率 / % |
|---|---|---|---|
| 固定 | 2 490.32 | 1 070.026 | 88.3 |
| 2次/年 | 2 590.69 | 1 112.722 | 87.5 |
| 3次/年 | 2 600.31 | 1 114.744 | 87.3 |
| 4次/年 | 2 611.25 | 1 118.224 | 87.1 |
| 12次/年 | 2 621.84 | 1 121.331 | 87.0 |
Table 5 Irradiation loss and other loss in the first year for different adjustment times表5 不同调节次数对应的首年辐射损失和其他损耗 |
| 调节次数 | 辐射损失 / % | 其他损耗 / % |
|---|---|---|
| 固定 | -7.80 | -12.3 |
| 2次/年 | -7.95 | -12.6 |
| 3次/年 | -8.12 | -12.6 |
| 4次/年 | -8.15 | -12.6 |
| 12次/年 | -8.23 | -12.6 |
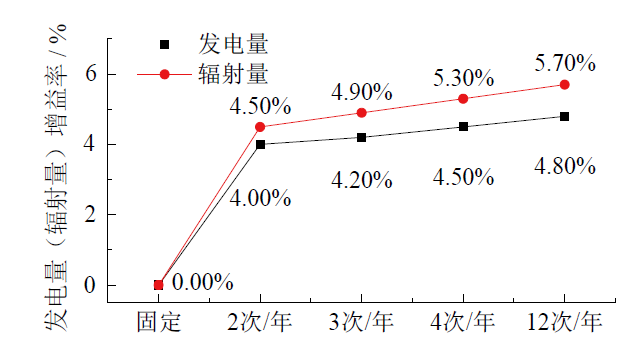
Fig. 14 Total irradiation and energy gain in the first year for different adjustment times图14 不同调节次数对应的组件整体辐射量增益与系统发电量增益比例 |
6.4 不同调节次数的双面发电系统收益对比
上文对不同调节次数的双面系统辐射量和发电量进行了分析,但是不同方案的决策还需要根据投入和产出进行经济性比较。由于资金具有时间价值,在25年全生命周期内,可以用差额净现值来衡量不同方案,即相对于固定支架方式,不同调节方案与其相比较后的发电收益差减去人工调节费用再进行折现,根据累计折现值的大小来判断方案的优劣。
不同调节次数对应的系统收益区别主要在于后期的人工调节成本,假设调节时按2人一组,3 ~ 5 min调节一个支架,528 kW共安排4人,约1 h可以调节完成,其中人工费按200元/(人∙次),假设费用每年按5%递增。光伏组件的衰减率按逐年0.7%考虑,如第2年系统发电量是在第一年的基础上降低0.7%。
格尔木地区属于一类资源区,在计算发电收益时,标杆电价按0.35元/(kW∙h)计,折现率按8%计。
不同调节次数对应的25年发电收益和考虑人工成本后的净收益对比,如表6所示。其中,随着调节次数的增加,25年发电量和发电收益均增加,但同时也带来人工成本的增加。
Table 6 System revenue comparison of bifacial system for different adjustment times表6 不同调节次数对应的双面发电系统收益对比 |
| 调节次数 | 25年发电量 / (MW∙h) | 25年发电收益 / 万元 | 25年人工调节费用 / 万元 | 25年增加净收益折现值 / 万元 |
|---|---|---|---|---|
| 固定 | 24 504 | 857.6 | 0.0 | 0.0 |
| 2次/年 | 25 481 | 891.8 | 6.4 | 12.6 |
| 3次/年 | 25 528 | 893.5 | 9.6 | 12.1 |
| 4次/年 | 25 607 | 896.3 | 12.8 | 12.1 |
| 12次/年 | 25 678 | 898.7 | 38.4 | 3.6 |
综合计算得出,对于528 kW的容量,当一年调节2次时,25年的发电收益为891.8万元,相比固定支架系统增加34.2万元,扣除人工费,并折现到第一年后,每年调节2次的净收益增加最多,为12.6万元,每年调节12次的净收益增加最少,为3.6万元。
6.5 不考虑背面发电情形下的对比分析
Table 7 System revenue comparison of monofacial PV system for different adjustment times表7 不同调节次数对应的单面发电系统收益对比 |
| 调节次数 | 25年发电量 / (MW∙h) | 25年发电收益 / 万元 | 25年人工调节费用 / 万元 | 25年增加净收益折现值 / 万元 |
|---|---|---|---|---|
| 固定 | 22 586.3 | 790.5 | 0.0 | 0.0 |
| 2次/年 | 23 630.7 | 827.1 | 6.2 | 12.3 |
| 3次/年 | 23 686.4 | 829.0 | 9.4 | 12.0 |
| 4次/年 | 23 777.7 | 832.2 | 12.5 | 12.1 |
| 12次/年 | 23 850.6 | 834.8 | 37.4 | 4.1 |
表8为不同调节次数下单面发电系统与双面发电系统的发电量对比,可看出双面发电系统的首年发电量均高于单面发电系统。当使用固定支架时,双面组件系统背面发电增益为8.5%,当使用可调支架,调节次数增加后,单面发电系统的首年发电量也随着调节次数的增加而增加,而与之比较的双面发电系统的背面发电增益略有下降,4种不同的调节方案之间,背面增益仅有0.1%的差异,意味着双面组件可调支架系统在使用不同的调节方案时,相对于固定支架系统,发电量增益主要还是取决于组件正面的发电增益。
Table 8 Energy yield comparison between bifacial PV system with the monofacial ones for different adjustment times表8 不同调节次数对应的单面发电和双面发电系统电量对比 |
| 调节次数 | 单面发电系统首年发电量 / (MW∙h) | 双面发电系统首年发电量 / (MW∙h) | 背面增益 / % |
|---|---|---|---|
| 固定 | 986.30 | 1 070.026 | 8.5 |
| 2次/年 | 1 031.91 | 1 112.722 | 7.8 |
| 3次/年 | 1 034.34 | 1 114.744 | 7.8 |
| 4次/年 | 1 038.33 | 1 118.224 | 7.7 |
| 12次/年 | 1 041.51 | 1 121.331 | 7.7 |
双面发电系统与单面发电系统人工调节支架的费用相同,除了电量差异,主要还体现在组件和支架成本的差异,成本费用随着市场调节而定,按当前的行情,双面组件的成本单价比单面组件约高0.05元/W左右,双面组件所用的支架单价比单面组件的支架约高10%左右。为了说明成本对收益的影响,假设单面组件的单价从1.1元/W到2.3元/W变化,除了组件和支架外,其他成本相同,其成本对比情况如表9所示。
Table 9 Cost difference between bifacial PV system with the monofacial system表9 单面发电与双面发电系统的成本差异 |
| 组件价格 / (元/W) | 支架单价 / (元/W) | 系统单价 / (元/W) | 系统投入成本 / 万元 | ||||||||
|---|---|---|---|---|---|---|---|---|---|---|---|
| 单面 | 双面 | 单面 | 双面 | 单面 | 双面 | 单面 | 双面 | 成本差额 | |||
| 1.10 | 1.15 | 0.10 | 0.11 | 3.20 | 3.26 | 168.96 | 172.13 | 3.17 | |||
| 1.20 | 1.25 | 0.15 | 0.17 | 3.35 | 3.42 | 176.88 | 180.31 | 3.43 | |||
| 1.30 | 1.35 | 0.20 | 0.22 | 3.50 | 3.57 | 184.80 | 188.50 | 3.70 | |||
| 1.40 | 1.45 | 0.25 | 0.28 | 3.65 | 3.73 | 192.72 | 196.68 | 3.96 | |||
| 1.50 | 1.55 | 0.30 | 0.33 | 3.80 | 3.88 | 200.64 | 204.86 | 4.22 | |||
| 1.60 | 1.65 | 0.35 | 0.39 | 3.95 | 4.04 | 208.56 | 213.05 | 4.49 | |||
| 1.70 | 1.75 | 0.40 | 0.44 | 4.10 | 4.19 | 216.48 | 221.23 | 4.75 | |||
| 1.80 | 1.85 | 0.45 | 0.50 | 4.25 | 4.35 | 224.40 | 229.42 | 5.02 | |||
| 1.90 | 1.95 | 0.50 | 0.55 | 4.40 | 4.50 | 232.32 | 237.60 | 5.28 | |||
| 2.00 | 2.05 | 0.55 | 0.61 | 4.55 | 4.66 | 240.24 | 245.78 | 5.54 | |||
| 2.10 | 2.15 | 0.60 | 0.66 | 4.70 | 4.81 | 248.16 | 253.97 | 5.81 | |||
| 2.20 | 2.25 | 0.65 | 0.72 | 4.85 | 4.97 | 256.08 | 262.15 | 6.07 | |||
| 2.30 | 2.35 | 0.70 | 0.77 | 5.00 | 5.12 | 264.00 | 270.34 | 6.34 | |||
如前文所述,对于双面组件发电系统,一年调节2次的调节方案为最佳,仅考虑发电收益和调节费用支出的情况下,将年发电收益与年调节费用的差额进行折现,折现到第一年后的总额为389.4万元,单面发电系统的折现总额为360.9万元。
Table 10 Revenue difference between bifacial PV system with the monofacial system表10 单面发电与双面发电系统的收益差异 |
| 成本差异百分比 / % (双面VS单面) | 发电净收益折现值(单面)/ 万元 | 发电净收益折现值(双面)/ 万元 | 净收益差额 / 万元 |
|---|---|---|---|
| 1.88 | 192 | 217 | 25.3 |
| 1.94 | 184 | 209 | 25.1 |
| 2.00 | 176 | 201 | 24.8 |
| 2.05 | 168 | 193 | 24.5 |
| 2.11 | 160 | 185 | 24.3 |
| 2.15 | 152 | 176 | 24.0 |
| 2.20 | 144 | 168 | 23.7 |
| 2.24 | 137 | 160 | 23.5 |
| 2.27 | 129 | 152 | 23.2 |
| 2.31 | 121 | 144 | 23.0 |
| 2.34 | 113 | 135 | 22.7 |
| 2.37 | 105 | 127 | 22.4 |
| 2.40 | 97 | 119 | 22.2 |
7 结论
研究可调支架双面发电系统角度变化对正面和背面辐射的影响,对于一年采用不同的调节次数,分析对比了发电量最大时的组件倾角、正背面辐射量、系统发电量和系统收益情况,同时与单面发电可调支架系统进行了经济性比较。结论如下:
(1)采用可调支架的双面发电系统,当组件角度发生变化,组件的最低点离地高度也会同时变化,直接影响到背面的辐射吸收。当组件角度增加时,正面和背面辐射量大小的变化趋势相反。
(2)相对于固定支架系统, 4种调节方式的组件背面全年辐射总量均下降,下降幅度为1% ~ 2%。
(3)可调系统的发电量大小与土地占有率GCR密切相关,当GCR降低时,光伏组件背面接收到的辐射量增加,发电量增加。
(4)按发电量最大原则进行月份组合,随着一年调节次数的增加,正面辐射量增加,正背面整体辐射量也增加。4种调节方式背面的辐射增益差异较小,仅为0.1%,因此系统发电量的增益主要取决于正面辐射量。其中,每年调节12次的发电量增益最多,比固定支架方案增加了4.8%。
(5)对于光伏电站全生命周期25年而言,光伏电站运行中由于调节支架会带来一定的人工成本,一般每年调节2 ~ 4次为宜,调节次数过多会增加人工费,从而会影响系统的收益率。对于格尔木地区,电价为0.35元/(kW∙h),人工成本为200元/(人∙次)的前提下,每年调节2次的系统收益增加最多。因此,该地区可调支架双面发电系统可采取每年调节2次,即按照冬(10月 ~ 次年3月)、夏(4月 ~ 9月)两季进行调节的方式。
(6)在当前的市场行情下,双面发电可调支架系统比单面可调支架系统有一定的优势:双面组件系统的发电量相对较高;在一年2次调节方式下,25年的发电收益增加64.7万元。考虑到组件和支架的成本差异,并将收益折现到第一年,当双面系统的成本比单面高出1.88%时,双面发电系统比单面发电系统多收益25.3万元。
因系统收益增加量与当地电价和人工成本有关,结论可能有所不同,在具体应用时,需根据实际情况,按照本文的分析思路进行系统的对比。
致谢
感谢行业资深人士周长友先生在本文修改环节所给予的启发性建议。
