

0 引言
2020年我国首次提出了要在2030年实现碳达峰,2060年实现碳中和的目标。由于传统石化能源的不可再生性以及污染问题,大力发展新能源是实现“双碳”目标的最佳途径。地热能作为可再生能源的一种,与太阳能、风能等可再生能源相比,具有资源储量巨大、稳定性相对较高等优点。而地热开发过程中,尤其是水热型地热资源开发过程中遇到的管道设备结垢问题,困扰和阻碍地热资源的高效低成本开发。地热电站中结垢类型主要为钙垢、硅垢、金属氧化垢及地热流体中含有的微细颗粒物、污泥、微生物、硫化物等。其中钙垢主要与压力有关,通常发生在井筒内压力降低而导致的闪蒸点附近,闪蒸使得大量二氧化碳析出,卤水酸性降低,碳酸钙过饱和而形成钙垢析出[4]。另外,CaCO3结垢堵塞在地热尾水回灌过程中是一个普遍的现象[2,3],就单个井而言,结垢现象在井底、井上及管道设备中都有可能出现,使地热能的效率大为降低。
刘明言[1]指出,目前在地热流体的腐蚀与结垢趋势预测方面的工作还相对较少,针对我国不同地区地热流体特性开展系统的腐蚀结垢趋势分析,以及三维多相传递和化学反应数值模拟研究是今后的方向。朱家玲等[5]对地热水结垢腐蚀趋势的判断方法进行了探讨,在地热水的Cl- 物质的量分数大于25%时,用雷诺兹指数判断有局限性,此时,应结合拉伸指数进行水质判断,才能使判断结果符合实际。PÁTZAY等[6]建立了CaCO3-H2O-CO2体系模拟地热井结垢方法,采用了Davies和Pitzer活度计算方法,对井内流动压降和温度变化采用了简单的线性化处理方法。ZOLFAGHARROSHAN等[7]用较为详细的多相流方法模拟了井筒流动换热情况,但对结垢的模拟仅仅用地面的成分情况进行判断,并未全程对井筒进行物理化学组分变化的计算跟踪。张恒等[8]利用美国地质调查局研发的PHREEQC软件,采用水文地球化学模拟技术对康定某高温地热井结垢问题进行了分析研究。结果表明,该地热井在开采过程中随着地热流体温度、pH、压力、氧化还原环境等条件变化发生严重的结垢现象。此外,除了水热型地热井,长期运行的干热岩系统也可能会在井筒和地面设备中出现矿物结垢现象[9]。
地热水结垢的基本物理化学机理已被研究得较为清楚,很多文献已进行过详细的论述。而在实际应用过程中,要想对结垢现象进行防治,需要在了解机理的基础上建立较为精确的计算模型对其预测。本文针对地热井内CaCO3垢形成情况进行详细的两相流动换热模拟,并对地热流体中化学组分的变化进行化学平衡计算模拟,以期获得特定地热条件下结垢情况的细致而精确的预测。
1 计算模型
1.1 井筒内CaCO3结垢基本物理化学机理
井筒结垢的形成基本机理是由于地热水溶液上升、压力不断降低。尽管水溶液上升过程中地层温度下降使得水溶液热损失温度有所降低,但由于压力下降更为迅速对应的饱和温度下降更为快速,因此在井筒某处会开始出现闪蒸,原先溶解在地热水溶液中的酸性气体CO2逸出进入蒸汽中,使得溶液pH升高,进而使CaCO3等溶解度达到饱和,析出固体形成结垢。
1.2 计算模型建立
井筒内CaCO3结垢原理虽已获公认,但对其进行精确的建模计算具有相当的复杂性,涉及两相流、地层换热和溶液物理化学变化,尤其是闪蒸过程。不凝气体组分和含量对结垢的影响问题涉及井筒的水溶液化学反应平衡和相平衡方面,以及地热水溶液在管道中的两相流流阻压降和地层热损失换热等方面,本文参考了文献[7,10-12],建立如下计算模型。
1.2.1 两相流计算模型
质量方程:
$\frac{\partial \rho }{\partial t}+\frac{\partial \left( \rho v \right)}{\partial l}=0$ (1)
其中:ρ为密度,m;v为速度,m/s;t为时间,s;l为井筒长度,m。稳态流动情况下没有质量累积,因此有:
$\frac{\partial \left( \rho v \right)}{\partial l}=0$(2)
动量方程:
$\frac{\partial \left( \rho v \right)}{\partial l}+\frac{\partial \left( \rho {{v}^{2}} \right)}{\partial l}=-\frac{\partial p}{\partial l}-\tau \frac{\text{ }\!\!\pi\!\!\text{ }d}{A}-\rho g\sin \theta $(3)
其中:p为压力,Pa;τ为摩擦系数,kg/(m∙s2),d为井筒内径,m;A为井筒内截面积,m2;g为重力加速度,m/s2;θ为井筒与水平方向的夹角,无量纲。联合质量方程,整理可得:
$\frac{\text{d}p}{\text{d}l}=-\tau \frac{\text{ }\!\!\pi\!\!\text{ }d}{A}-\rho g\sin \theta -\rho v\frac{\text{d}v}{\text{d}l}$(4)
如为两相流,可将流体当作气液均相混合物,井为竖直井,上式可变为:
$-\frac{\text{d}p}{\text{d}z}=g{{\rho }_{\text{mix}}}\text{sin}\theta +\frac{{{f}_{\text{mix}}}v_{\text{mix}}^{2}{{\rho }_{\text{mix}}}}{2d}+{{\rho }_{\text{mix}}}{{v}_{\text{mix}}}\frac{\text{d}{{v}_{\text{mix}}}}{\text{d}z}$ (5)
其中:下标mix表示混合参数;z为竖直方向长度,m。根据不同的流型计算出不同的摩擦因子,需要用到占空比和混合密度。气液两相流可分为bubbly、slug、churn和annular四种流型[10]。
能量方程:
$\frac{\text{d}h}{\text{d}l}=-v\frac{\text{d}v}{\text{d}l}-g\sin \theta -\frac{\text{d}q}{\text{d}l}$ (6)
其中:h为焓,J/kg;q为单位质量流量单位管长内的换热量,W/(kg/s),可参考文献[11]:
$q=\frac{l\text{ }\!\!\pi\!\!\text{ }dU\left( T-{{T}_{\text{ei}}} \right)}{{\dot{m}}}$ (7)
其中:l为管长,m;$\dot{m}$为质量流量,kg/s;Tei为地层温度,K;U为总传热系数,W/(m2∙K),可近似计算为:
$U=\frac{0.6k}{d}$ (8)
式中:k为有效导热系数,W/(m∙K),其地热井典型值为4 W/(m∙K)。
1.2.2 化学平衡、相平衡模型
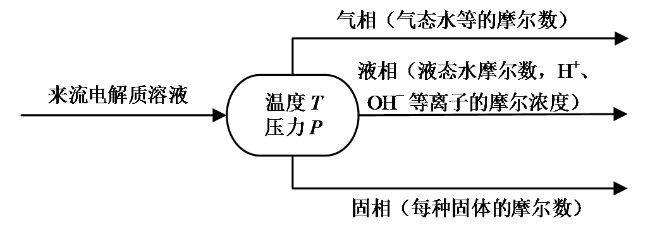
Fig. 1 Schematic of phase equilibrium model of electrolyte solution图1 电解质溶液相平衡模型图 |
物料衡算式:
${{F}_{\text{out},i}}={{F}_{\text{in},i}}+\underset{j=1}{\overset{M}{\mathop \sum }}\,{{v}_{i,j}}{{\xi }_{j}}$ (9)
其中:Fin,i和Fout,i分别为电离或离解反应前后各组分i的摩尔流量,mol/s;ν为化学计量系数,无量纲;ξ为反应程度,mol/s;j为某个平衡方程;M为总的平衡方程数量。
因此,化学反应平衡后更新的各组分组成为:
${{z}_{i}}=\frac{{{F}_{\text{out},i}}}{\mathop{\sum }_{i}^{N}{{F}_{\text{out,}i}}}$ (10)
总物料衡算式为:
$\begin{align} & F=L+V \\ & F{{z}_{i}}=L{{x}_{i}}+V{{y}_{i}} \\\end{align}$ (11)
其中:F为所有相中物料的总和,L为液相物料,V为气相物料,单位均为mol/s;x为液相组成,y为气相组成,z为各相中的物料组成,均为无量纲;N为总的物料的种类。
能量衡算式:
${{H}_{\text{L}}}L+{{H}_{\text{V}}}V={{H}_{\text{F}}}F+Q$ (12)
其中:HL、HV和HF分别为液相、气相和所有相总和的摩尔焓,J/mol;Q为换热量,W。
相平衡:
${{y}_{i}}={{K}_{i}}{{x}_{i}}$ (13)
其中:K为亨利系数,无量纲。上式可理解为根据亨利定律,在一定温度和平衡状态下,气体在液体中的溶解度(用摩尔分数表示)和该气体的平衡分压成正比。
化学反应平衡:
${{K}_{j}}=\underset{i=1}{\overset{N}{\mathop \prod }}\,{{\left( {{\gamma }_{i}}{{x}_{i}} \right)}^{{{\nu }_{ij}}}}=\underset{i=1}{\overset{N}{\mathop \prod }}\,{{\left( \frac{{{p}_{i}}{{{\hat{\phi }}}_{i}}}{f_{i}^{0}} \right)}^{{{\nu }_{ij}}}}$ (14)
组分约束:
$\begin{matrix} \underset{i=1}{\overset{{{N}_{\text{m}}}}{\mathop \sum }}\,{{y}_{i}}=1 \\ \underset{i=1}{\overset{N}{\mathop \sum }}\,{{x}_{i}}=1 \\\end{matrix}$ (15)
其中:Nm为气相分子种类数,m表示分子。
电中性平衡:
$\underset{i=1}{\overset{N}{\mathop \sum }}\,{{Z}_{i}}{{x}_{i}}=0$ (16)
此时的Zi表示离子种类所带电荷的真实值,而不是绝对值,无单位。
物性关联式:
$\begin{align} & {{H}_{\text{F}}}=H\left( {{P}_{\text{F}}},{{T}_{\text{F}}},{{z}_{i}} \right) \\ & {{H}_{\text{V}}}=H\left( P,T,{{y}_{i}} \right) \\ & {{H}_{\text{L}}}=H\left( P,T,{{x}_{i}} \right) \\ & {{K}_{i}}=K\left( P,T,{{x}_{i}},{{y}_{i}} \right) \\ & {{K}_{j}}=K\left( T,P \right) \\ \end{align}$ (17)
1.2.3 结垢判断
$\text{SI}=\text{lg}\frac{\left\{ \left[ \text{Me} \right]\left[ \text{An} \right] \right\}}{{{K}_{\text{sp}}}}$ (18)
其中:[Me]是二价阳离子;[An]是二价阴离子;结垢指数SI = 0表示平衡,SI > 0表示过饱和产生结垢;Ksp为溶解度。
对于常见的碳酸钙结垢,可采用以下关联式[7]:
$\begin{align} & \text{SI}=\text{lg}\left\{ \frac{\left[ \text{C}{{\text{a}}^{\text{2+}}} \right]\left[ \text{HCO}_{\text{3}}^{\text{2}-} \right]}{Py_{\text{g}}^{\text{C}{{\text{O}}_{\text{2}}}}f_{\text{g}}^{\text{C}{{\text{O}}_{\text{2}}}}} \right\}+6.33+ \\ & 15.0\times {{10}^{-3}}T-5.31\times {{10}^{-6}}{{T}^{2}}- \\ & 5.27\times {{10}^{-5}}P-3.334S_{i}^{0.5}+1.431{{S}_{i}} \end{align}$ (19)
式中:T为温度,℃;P为压力,单位为psi;离子强度S为:
$S=\frac{1}{2}\underset{i=1}{\overset{N}{\mathop \sum }}\,{{C}_{i}}Z_{i}^{2}$ (20)
其中:Ci为各组分浓度,mol/kgw(kgw表示1 kg地热水)。
1.2.4 气泡点的判断
气泡的起始点可根据各不凝性气体分压加和是否超过了当地压力来进行判断:
$\sum\limits_{i=1}^{n}{\left( {{K}_{i}}{{x}_{i}} \right)=1}$ (21)
1.3 模型求解算法
将井筒内地热水流动简化为一维流动,在长度方向上将井筒分为若干个单元,从底部向上依次逐步推进计算各单元参数,包括换热、流动、组分变化、结垢情况等。单元计算流程如图2所示。
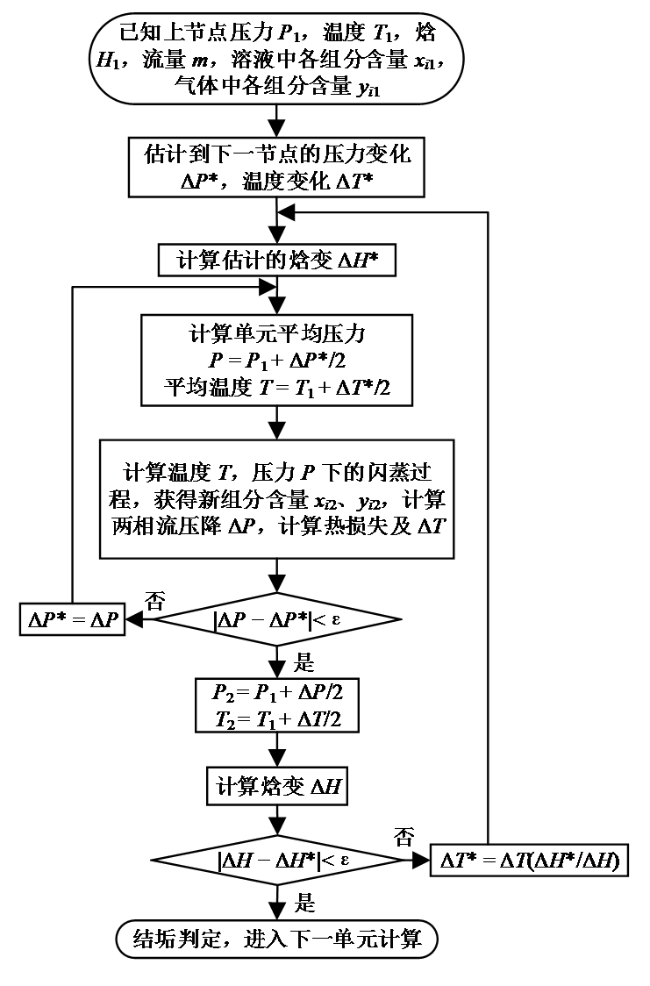
Fig. 2 Flow chart of a calculation unit图2 单元计算流程图 |
闪蒸算法是最为复杂的部分,可参考化工计算模拟的闪蒸分离过程算法[12],该方法是对于包含N个组分(所有离子和分子)并且发生M个电离或水解等化学反应的两相体系,根据电离平衡和相平衡关系得到一个N + M维方程组,并通过Marquardt迭代方法求解非线性方程组实现。
每个单元的计算最后都做一次饱和指数的计算,判断是否开始结垢,如果结垢发生,则析出一定的量,使得溶液正好恢复当时条件下的饱和状态,从而获得各组分平衡关系。
1.4 化学反应方程和相变平衡方程
Table 1 Chemical reaction and phase change equilibrium equations involved in this simulation program表1 计算程序所涉及的化学反应方程和相变平衡 |
| 序号 | 方程式 |
|---|---|
| 1 | ${{\text{H}}_{2}}\text{O}+\text{C}{{\text{O}}_{2(\text{aq})}}\leftrightarrow \text{HC}{{\text{O}}_{3}}^{-}+{{\text{H}}^{+}}$ |
| 2 | $\text{HC}{{\text{O}}_{3}}^{-}\leftrightarrow \text{C}{{\text{O}}_{3}}^{2-}+{{\text{H}}^{+}}$ |
| 3 | ${{\text{H}}_{\text{2}}}\text{O}\leftrightarrow {{\text{H}}^{+}}+\text{O}{{\text{H}}^{-}}$ |
| 4 | $\text{CaHC}{{\text{O}}_{3}}^{+}\leftrightarrow \text{C}{{\text{a}}^{\text{2+}}}+\text{HC}{{\text{O}}_{3}}^{-}$ |
| 5 | $\text{CaC}{{\text{O}}_{3}}^{0}\leftrightarrow \text{C}{{\text{a}}^{2+}}+\text{C}{{\text{O}}_{3}}^{2-}$ |
| 6 | $\text{Ca(OH}{{\text{)}}^{+}}\leftrightarrow \text{C}{{\text{a}}^{2+}}+\text{O}{{\text{H}}^{-}}$ |
| 7 | ${{\text{H}}_{2}}{{\text{O}}_{\text{(aq)}}}\leftrightarrow {{\text{H}}_{2}}{{\text{O}}^{\text{g}}}$ |
| 8 | $\text{C}{{\text{O}}_{2(\text{aq})}}\leftrightarrow \text{C}{{\text{O}}_{2}}^{\text{g}}$ |
| 9 | $\text{NaC}{{\text{l}}^{\text{s}}}(\text{岩盐)}\leftrightarrow \text{N}{{\text{a}}^{+}}+\text{C}{{\text{l}}^{-}}$ |
| 10 | $\text{CaC}{{\text{O}}_{3}}^{\text{s}}(\text{方解石)}\leftrightarrow \text{C}{{\text{a}}^{2+}}+\text{C}{{\text{O}}_{3}}^{2-}$ |
| 11 | $\text{C}{{\text{H}}_{4(\text{aq)}}}\leftrightarrow \text{C}{{\text{H}}_{4}}^{\text{g}}$ |
注:下角标aq表示在水溶液中,g表示气相,s表示固相。 |
2 结果与分析
计算程序采用Python计算机语言,在Visual studio 2019集成开发环境中编写了上述计算模型程序。使用Tkinter库制作简单的参数输入界面,可方便地输入各个算例参数。
目前常用的结垢模拟软件有Wellsim、Phreeqc等,均为国外软件,无法掌握内部计算模型细节,国内尚未有专门的地热井结垢计算软件。本文模拟计算工作的特点是可以考虑各种不凝性气体的影响,两相流计算可细化至不同流型的影响等。而且计算过程中使用到的各个计算模型,如两相流压降计算、活度系数、逸度系数模型、迭代模型等各方面均可随时替换或优化,所有参数均可根据需要做出调整。
2.1 算例分析
算例输入参数:井筒长度为1 000 m、直径为200 mm,管道表面粗糙度0.015,井底温度70℃,压力11.2 MPa,流量2.5 kg/s。输入流体组分Ca2+ 浓度为4 mg/kgw,HCO3- 浓度为12.18 mg/kgw,CO2浓度为50 mg/kgw,CH4浓度为200 mg/kgw。地温梯度按照地面温度25℃至井底线性变化计算。
Table 2 Concentration of each component in the geothermal water at different depths of the well表2 井内地热水不同深度下各组分浓度 |
| 条件 | 物质浓度 / (mol/kgw) | |||||||||||||
|---|---|---|---|---|---|---|---|---|---|---|---|---|---|---|
| H+ | OH- | HCO3- | CO32- | CO2(aq) | CH4(aq) | Ca2+ | CaHCO3+ | CaCO30 | Ca(OH)+ | H2O(aq) | H2O(g) | CO2(g) | CH4(g) | |
| h = 1 000 m T = 343.15 K P = 112.0 bar | 2.84×10⁻⁶ | 5.90×10⁻⁸ | 2.02×10⁻⁴ | 5.47×10⁻⁹ | 1.13×10⁻³ | 1.25×10⁻² | 9.93×10⁻⁵ | 4.81×10⁻⁷ | 3.52×10⁻⁹ | 2.62×10⁻⁷ | 55.540 76 | 0.00 | 0.00 | 0.00 |
| h = 150 m T = 342.436 K P = 18.7 bar | 2.81×10⁻⁶ | 5.53×10⁻⁸ | 2.02×10⁻⁴ | 5.44×10⁻⁹ | 1.13×10⁻³ | 1.25×10⁻² | 9.93×10⁻⁵ | 4.79×10⁻⁷ | 3.42×10⁻⁹ | 2.32×10⁻⁷ | 55.540 76 | 0.00 | 0.00 | 0.00 |
| h = 60 m T = 342.278 K P = 8.8 bar | 8.51×10⁻⁶ | 1.74×10⁻⁸ | 6.81×10⁻⁵ | 6.08×10⁻¹⁰ | 1.16×10⁻³ | 7.28×10⁻³ | 2.99×10⁻⁵ | 4.86×10⁻⁸ | 1.15×10⁻¹⁰ | 2.27×10⁻⁸ | 55.540 81 | 1.82×10⁻⁵ | 4.33×10⁻⁵ | 5.22×10⁻³ |
| h = 0 m T = 342.164 K P = 2.2 bar | 6.81×10⁻⁶ | 2.15×10⁻⁸ | 6.64×10⁻⁵ | 7.40×10⁻¹⁰ | 9.00×10⁻⁴ | 1.68×10⁻³ | 2.99×10⁻⁵ | 4.74×10⁻⁸ | 1.39×10⁻¹⁰ | 2.80×10⁻⁸ | 55.540 67 | 1.6×10⁻⁴ | 3.00×10⁻⁴ | 1.08×10⁻² |
图3为算例的输出数据结果绘制的温度、压力变化,泡点之后的地热水pH,气相、液相组分以及CO2分压变化曲线图。在2.5 kg/s流量的地热条件下,温度下降较小,压力呈线性下降。泡点之后由于CO2逸出,地热水pH逐渐加速升高,CO2分压呈现加速下降的模式,曲线变化趋势符合碳酸钙垢形成的机理。图3c中气体的组分变化表明CH4气体比CO2有更快的增长速度,是由于CH4在水中具有较低的溶解度。图3d为液相中各组分的变化曲线,可知溶液中除了游离CO2分子、CH4分子、HCO3-、Ca2+ 外,其他组分浓度较低,小于1 × 10⁻⁵ mol/kgw。总之,泡点后相应数据逐步变化明显,而泡点之前除总压外其他参数几乎不变。
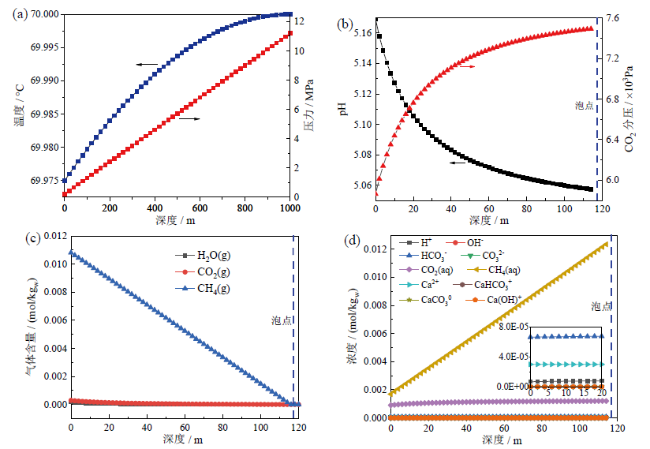
Fig. 3 (a) Temperature and pressure distribution along the well; (b) CO2 partial pressure and pH evolution after bubble point; (c) concentration evolution of gas components after bubble point; (d) concentration evolution of liquid components after bubble point图3 (a)温度压力随井深变化曲线;(b)泡点之后CO2分压和pH值随井深变化曲线;(c)泡点之后气相组成随井深变化曲线;(d)泡点后溶液中各组分变化情况 |
2.2 不凝性气体含量对结垢量和泡点位置的影响分析
图4为以上述算例为基准,改变井底温度和CO2含量两个变量,获得的不同地温条件下CO2含量与最终结垢量的变化曲线。最终结垢量是根据CaCO3饱和指数,将其维持小于零来计算析出量。从图中可以看出,在70℃地温条件下,结垢量随着CO2含量的增加而减少,增加到一定浓度后,结垢量趋近于0。而相同CO2含量下,随着地温的升高,结垢量更多,但由于Ca2+ 数量的限制,结垢量也有一定的最大值。
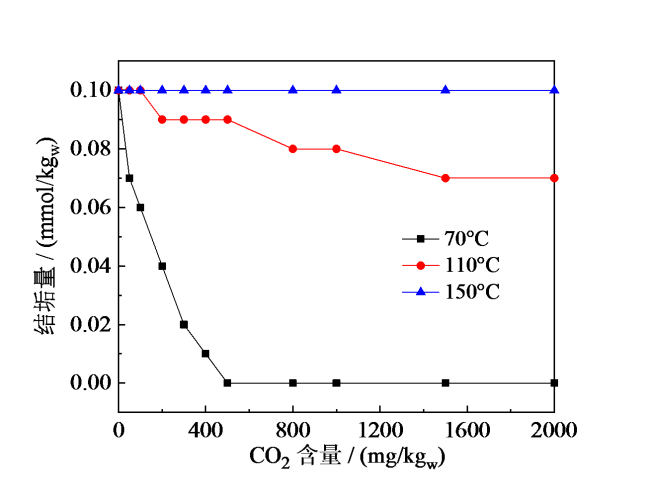
Fig. 4 Relation of scale quantities with CO2 concentration under different well fluid temperatures图4 不同温度下结垢量与CO2含量关系 |
图5为上述算例条件下,分别改变每千克地热水中CH4和CO2的含量对泡点位置的影响。从图中可以看出泡点位置与这两种不凝性气体的含量呈现线性增加关系。一般情况下,泡点的位置即为结垢开始出现的位置。随着不凝性气体含量的增加,气体更容易从水溶液中逸出,闪蒸点的位置会更深。
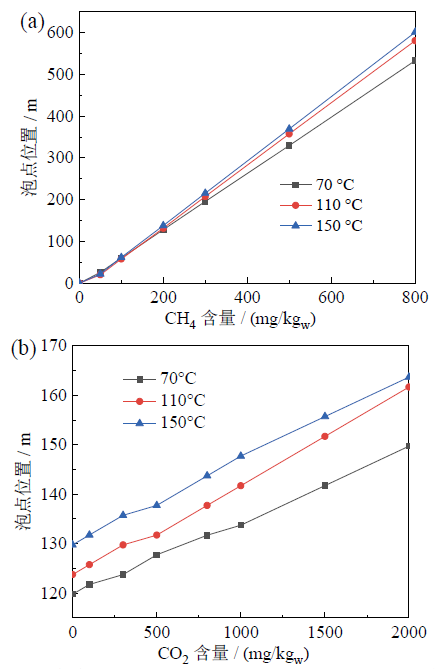
Fig. 5 The effect of CH4 (a) and CO2 (b) concentration on bubble point图5 地热水中CH4含量(a)和CO2含量(b)对泡点位置的影响 |
此外,需要说明的是本文算例是根据各类情况综合考虑,通过改变相应参数条件来考察结垢模拟方法和结垢形成特性问题,并非某个特定井的具体参数。如需要对某个地热井实际数据进行验证对比,还需要根据该实际井添加相应的化学组分,进而在程序中关联相应的化学反应方程、相平衡方程,结垢也不仅限于CaCO3垢,可能是硅酸盐、硫酸盐或多种成分都存在,气体也不仅有CH4、CO2,还可能有H2S、NH3、N2等,这些都需要在程序中重新做针对性的修改和录入相关参数。但模型方程和算法与上述一致,是通用的。上述算例中计算出的泡点位置与参考文献[6]大致数量级相同,因此计算结果在合理范围内吻合。
3 结论
将两相流计算模型与化学反应平衡模型以及化工闪蒸计算模型相结合,对地热井内的流动进行精细模拟,获得温度、压力、溶液及气相中各组分的变化情况,分析其pH变化、气相分压、沸腾起始点,并进行结垢判断等。经过试运算,模拟结果的数值较为合理,能够测算出CO2分压的指数性减小,pH的变化亦呈指数增大趋势。同时,经过对比分析还得出以下两个结论:(1)随着CO2含量的增加,结垢量逐渐减少直至不结垢,而地热水温度越高越容易发生结垢;(2)随着不凝性气体的增加,泡点位置即结垢位置更深。
本文的地热水化学成分组成仅考虑了Ca2+、HCO3- 以及CO2和CH4不凝性气体组分,真实的地热井卤水含有更多更复杂的组分组成,可在此模型框架的基础上,增加更多物质组分,并尽可能利用更精准的化学反应平衡常数、亨利系数等化工常数,即可准确地模拟真实的地热井流动和化学变化情况。
