

0 引言
漂浮式风力机由风轮、漂浮式平台、系泊结构组成,主要适用于离岸600海里以外、水深大于50 m的远海域。与固定式海上风机相比,漂浮式海上风机可以安装在风资源更丰富、海上气候条件更恶劣的深水海域区,具有更好的适用性和经济性[1]。对于漂浮式海上风力机,海上风-浪-流的存在使得海上风力机平台产生六个自由度方向的运动,均会对风力机的气动性能和尾流特性产生较大影响,其中与来流风速同轴且会改变风力机俯仰状态的纵摇运动对风力机的影响更为显著。同时海上的实际运行环境比较复杂,风剪切和大气湍流层对漂浮式风力机的影响较为明显,风力机的尾流对叶片会产生非定常气动力的影响,使海上风电机的尾流以及气动性能、结构响应发生变化,尾流在扩散过程中与海上波浪动边界的摩擦也会使得海上风机尾流的扩散和发展与陆上风机有所不同。当前在工程上普遍使用的致动盘或致动线模型,难以从机理上揭示海上复杂条件下风力机尾流扩散、发展过程。
在漂浮式风力机的数值研究领域,目前已有不少学者从不同方法与方向开展了研究。2009年,美国可再生能源实验室(National Renewable Energy Laboratory, NREL)的JONKMAN等[2]基于NREL 5MW风力发电机开发了张力腿式、桅杆式和驳船式三种漂浮式支撑平台的FAST模型,为海上漂浮式风力机的研究奠定了基础。之后CORDLE等[3]使用叶素动量理论(blade element momentum, BEM)方法对漂浮式风力机进行动态计算,采用不同代码所对应的模型方法,并分析了这些方法的优缺点。MICALLEF等[4]使用基于致动盘的Navier-Stokes模型、BEM方法和广义动态尾迹模型对纵荡状态下的NREL 5MW风力机叶轮进行了数值模拟。TRAN等[5]基于非定常计算流体力学方法,研究了由于叶轮周期性俯仰运动引起的涡-尾流-叶片相互作用对海上漂浮式风力机气动性能的影响。王磊等[6]通过多体动力学模型对漂浮式风力机组进行了研究,简化了系泊系统受力与结构运动之间的非线性动力耦合关系,并对漂浮式风力机系统和近海的固定式风力机进行了对比分析。CHEN等[7]通过非定常雷诺平均法(Reynolds averaged Navier-Stokes, RANS)进行漂浮式风力机在给定海况下的非定常数值模拟,并与BEM方法和涡方法结果进行对比验证,对浮式平台的运动响应进行研究。美国ArcVera Renewables公司利用风电场参数化软件中的高保真的天气预测模型,研究风力机远场的尾流损失,发现大功率海上风机尾流的影响范围最高可能达到100 km,认为目前常见的工程模型都严重低估了远场尾流造成的风能损失[8]。
以漂浮式海上风力机的纵摇运动为研究重点,仿真基于OpenFOAM平台,采用RANS方法的k-ε模型,建立风场模型和风剪切来流条件,模拟大气湍流条件,简化漂浮式平台六自由度运动,设置动网格并采用固定纵摇运动方程的方法模拟风场中单台NREL 5MW风力机的纵摇运动,研究其对尾流特性和扩散机理的影响,揭示纵摇运动条件下叶片非定常气动力对尾流的影响,为海上风电场微观选址提供更为精确的物理依据,其他类型的平台运动工况将在后续工作中进行研究。
1 数值计算方法
数值模拟基于非定常、三维不可压Navier-Stocks方程,控制方程为:
$\left\{ \begin{align} & \nabla \cdot u\text{ = 0} \\ & \frac{\partial u}{\partial t}+(u\cdot \nabla )u=-\frac{1}{\rho }\nabla p+v{{\nabla }^{2}}u \\ \end{align} \right.$ (1)
式中:u为流体速度;t为时间;$rho$ 气密度;p为无量纲化压强;v为运动黏度系数。
使用RANS k-ε湍流模型,采用重叠网格技术与动网格技术实现NREL 5MW漂浮式风力机的纵摇运动,OpenFOAM求解器采用适用于重叠网格及瞬态、不可压缩流体的overPimpleDyMFoam求解器,方程的离散格式均采用二阶迎风格式。
1.1 计算模型选取
1.2 计算域设定
风场计算域由流场域、纵摇域和旋转域三部分组成,其中纵摇域和旋转域均为重叠网格区域。设定长方体流场域的高度为6D(D为风轮直径),宽度为6D,速度来流方向为x轴方向,水平方向为y轴方向,竖直方向为z轴方向;风力机叶轮位于计算域中心,距离速度入口面4D距离;为了保证风力机尾流的充分扩散,计算域出流面距离风力机叶轮16D。旋转域为圆柱体,直径为140 m,高度为12 m,纵摇域为长方体,大小尺寸为0.5D × 0.5D × 1.5D。整体示意图如图1 所示。
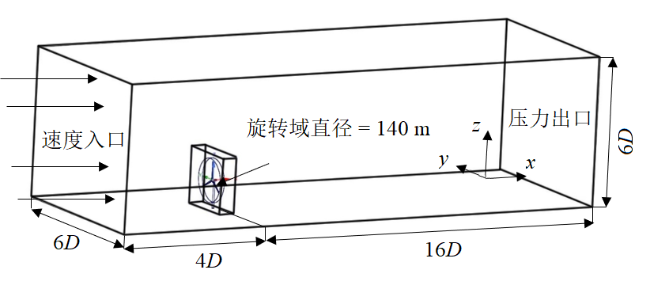
Fig. 1 Schematic diagram of computational domain图1 计算域示意图 |
1.3 边界条件设置
定义流场入口为速度入口边界,出口为压力出口,下壁面、叶片表面、塔架和轮毂均为无滑移边界条件,上壁面为滑移边界条件,两侧面为对称边界条件。入口速度通过编译用户自定义函数(user defined function, UDF)设定为剪切来流条件,其具体表现为沿z轴的指数分布:
$v(h)={{v}_{0}}{{\left( \frac{h}{H} \right)}^{a}}$ (2)
式中:v(h)为距地高度h处的风速;v0为风力机轮毂高度处的风速,大小为风力机额定风速11.4 m/s;H为风力机轮毂高度,大小为90 m;a为风速廓线指数,大小为0.1。参考文献[10]中湍流强度对风轮扭矩的影响,选择5%的来流湍流强度进行计算。
1.4 网格划分
使用ANSYS的前处理软件ICEM对计算模型进行结构性网格划分,如图2 所示。为保证叶片气动性能计算的精度,对叶片周围O型区域与叶片区域进行局部加密。对流场域网格采用相对稀疏的网格划分,在纵摇域及周围区域进行适当的网格加密。整体网格总数约为1.445 × 10⁷,最小网格尺寸为0.01 m。
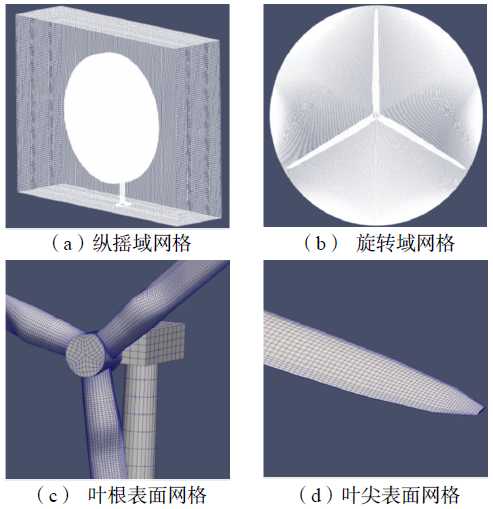
Fig. 2 Grids of computational domain图2 计算域网格 |
1.5 纵摇运动计算设置
OpenFOAM的重叠网格技术可以实现网格的相对运动,将整体计算网格分为三个部分,分别为流场域网格、纵摇域网格和旋转域网格,其中纵摇域网格与旋转域网格耦合保持相对静止,以相同的频率进行前后摆动,纵摇运动角度变化依据角速度公式编译UDF进行控制,模拟风力机整体的纵摇运动:
${{\omega }_{p}}=2\text{ }\!\!\pi\!\!\text{ }fA\cos \left( 2\text{ }\!\!\pi\!\!\text{ }ft \right)$ (3)
式中:A为纵摇的振幅;${{\omega }_{p}}$为纵摇运动的角速度变化;f为运动频率。同时旋转域以额定转速12.1 r/min绕穿过旋转域中心的x轴进行旋转。图3 为风力机纵摇运动的示意图。
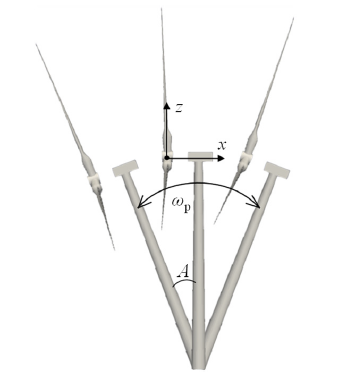
Fig. 3 Schematic diagram of pitch motion图3 纵摇运动示意图 |
Table 2 Pitch motion cases表2 纵摇运动工况计算设置 |
| 工况编号 | 风力机转速n / (r/min) | 振幅A / ° | 频率f / Hz |
|---|---|---|---|
| 1 | 12.1 | 0 | 0.0 |
| 2 | 12.1 | 1 | 0.1 |
| 3 | 12.1 | 1 | 0.2 |
| 4 | 12.1 | 4 | 0.1 |
| 5 | 12.1 | 4 | 0.2 |
1.6 网格无关性验证
为确保数值计算的准确性,设计了四种不同网格数量的计算域进行计算对比,分别为7.040 × 10⁶、8.650 × 10⁶、1.445 × 10⁷与2.023 × 10⁷,如表3所示。结果表明,1.445 × 107网格数量的数值模型基本满足计算需求,网格数量更大的模型结果可能更加准确,但是需要的计算时间成本会大幅增加,网格数量更少虽然能够更快速地收敛但准确度不够。综合考虑以上条件,研究采用1.445 × 10⁷网格数量的数值模型进行计算。
Table 3 Wind turbine torque of different sizes表3 不同网格数量风力机扭矩对比 |
| 网格数量 | 扭矩 / (N∙m) | 相对误差 / % |
|---|---|---|
| 7.040 × 10⁶ | 3.72 × 10⁶ | 8.8 |
| 8.650 × 10⁶ | 3.81 × 10⁶ | 6.6 |
| 1.445 × 10⁷ | 3.93 × 10⁶ | 3.7 |
| 2.023 × 10⁷ | 3.96 × 10⁶ | 2.9 |
| 设计值 | 4.08 × 10⁶ | / |
2 计算结果与分析
2.1 功率计算
Table 4 Results of wind turbine power under different wind speed表4 不同来流风速下风力机功率计算结果 |
| 来流风速 / (m/s) | 风力机转速 / (r/min) | 风力机功率 / MW |
|---|---|---|
| 3.0 | 6.9 | 0.02 |
| 5.0 | 6.9 | 0.36 |
| 8.0 | 9.7 | 1.67 |
| 11.4 | 12.1 | 4.94 |
| 15.0 | 12.1 | 5.02 |
由图4 可知,当来流风速不高于额定风速时,OpenFOAM的计算结果均略低于FAST的计算结果,由于本研究模型忽略了风轮的初始仰角,导致计算的功率偏低。图5 展示了无纵摇工况下两个旋转周期内风力机功率随时间变化的曲线,风力机在运行2个周期后,功率逐渐稳定在额定功率的水平。
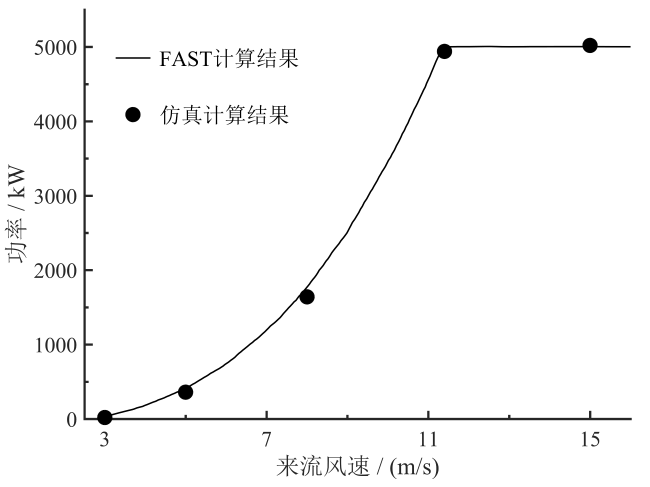
Fig. 4 Comparison of FAST power curve with OpenFOAM calculation results图4 FAST功率曲线数据与OpenFOAM计算结果对比图 |
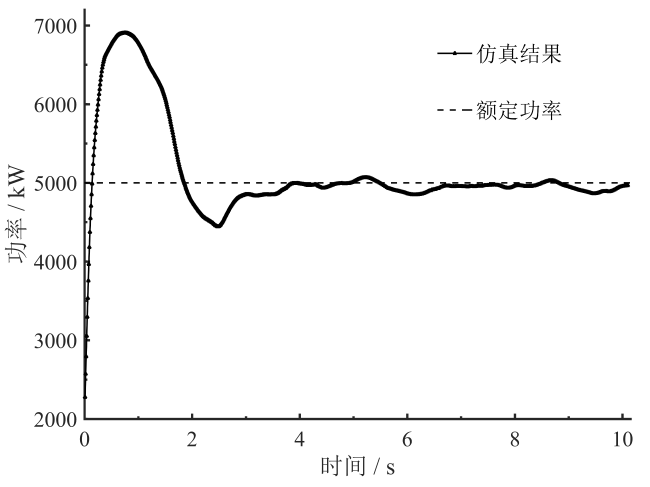
Fig. 5 Power curve of wind turbine with time图5 无纵摇工况下风力机功率随时间变化曲线图 |
2.2 风力机尾流计算
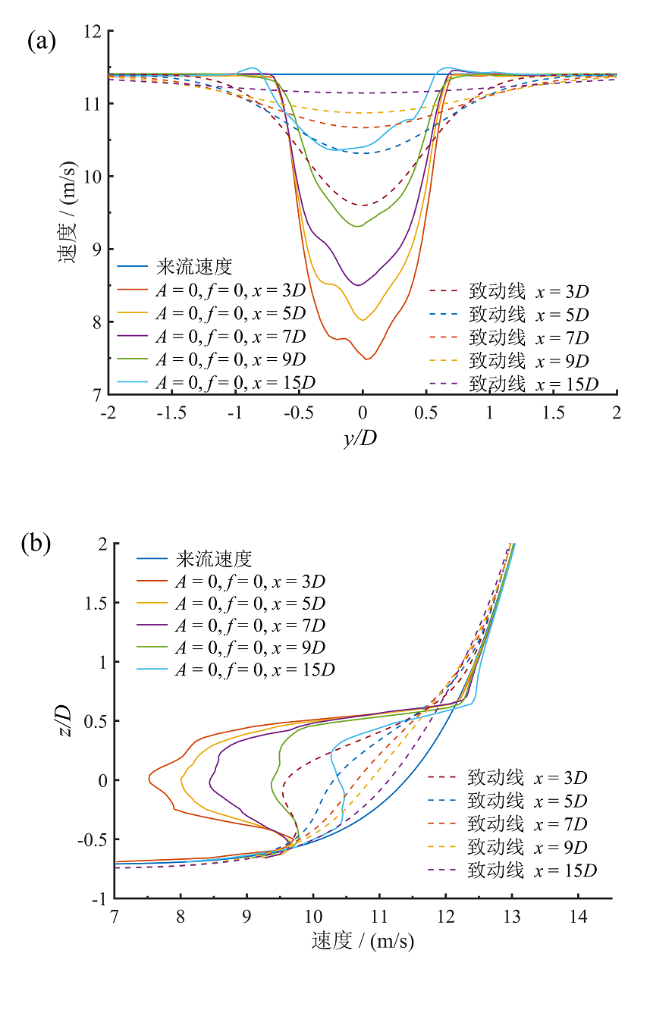
Fig. 6 Comparison of horizontal (a) and vertical (b) mean velocity distribution of wind turbine wake with actuator line method results图6 无纵摇工况下风力机尾流水平方向(a)和垂直方向(b)平均速度分布曲线与致动线模型计算结果对比图 |
纵摇工况与无纵摇工况的尾流风速分布对比如图7 和图8 所示,与无纵摇工况相比,风力机的纵摇运动会对叶轮附近流场产生一定的扰动作用,增大近场尾流区的湍流度,从而加速尾流风速的恢复。
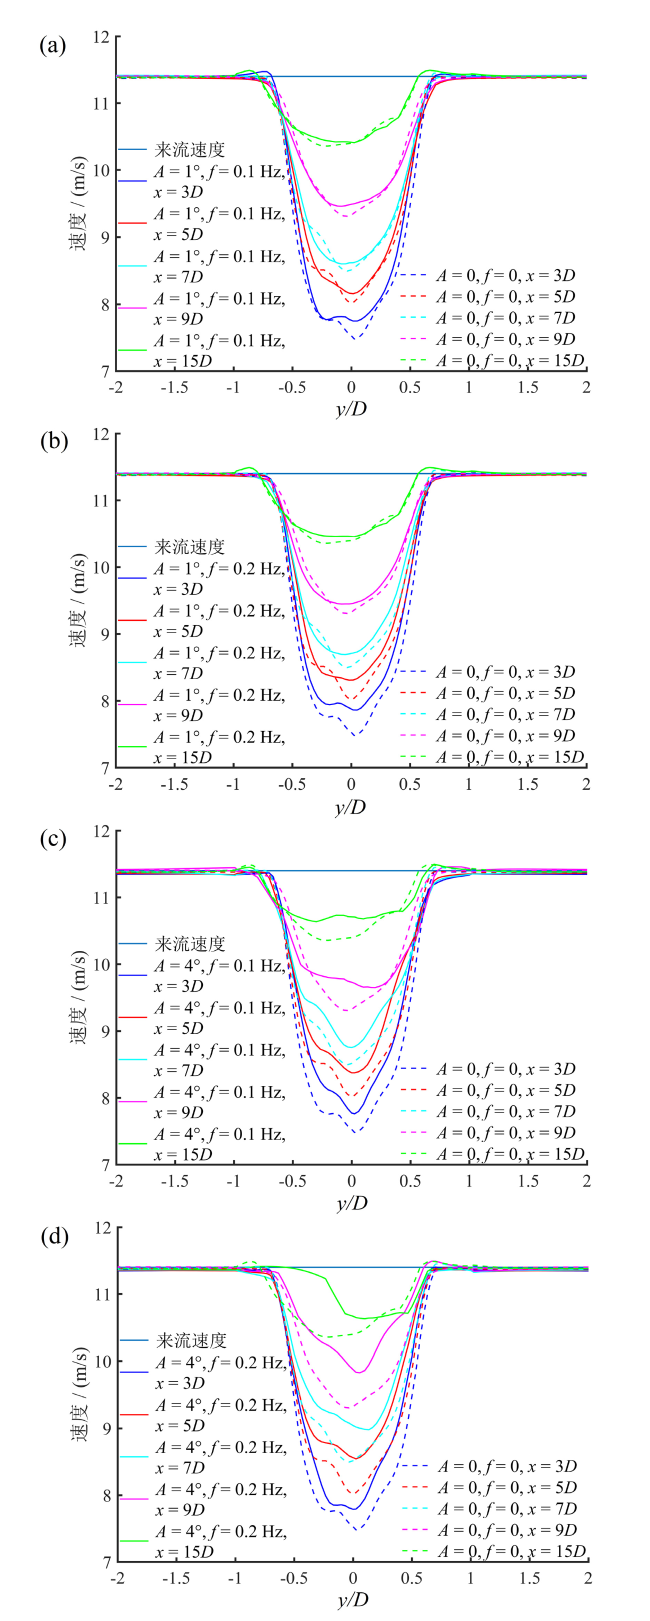
Fig. 7 Comparison of the horizontal mean velocity distribution curve of wake under pitch motion 2-5 (a-d) with the results without pitch motion图7 纵摇工况2 ~ 5(a ~ d)下尾流水平方向平均速度分布曲线与无纵摇工况计算结果对比图 |
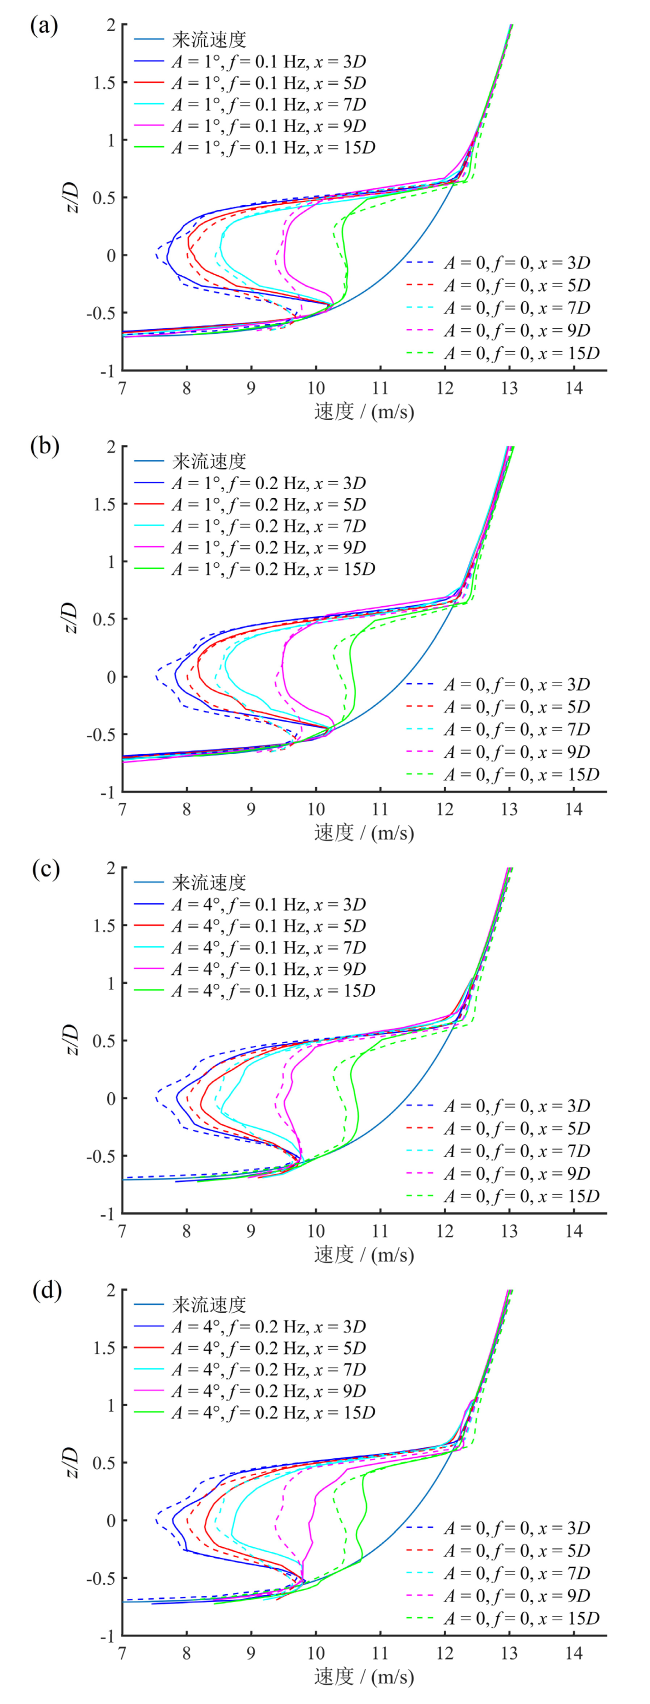
Fig. 8 Comparison of the vertical mean velocity distribution curve of wake under pitch motion 2-5 (a-d) with the results without pitch motion图8 纵摇工况2 ~ 5(a ~ d)下尾流竖直方向平均速度分布曲线与无纵摇工况计算结果对比图 |
由图7 和图8 可知,在近场尾流区域,纵摇运动对尾流速度产生了一定的影响,加速了尾流恢复的过程,且随着纵摇运动的频率与幅值增大,尾流恢复速度也会进一步加快;对于远场尾流区域,较弱的纵摇运动对尾流恢复的作用不明显,而当纵摇振幅为4°、频率为0.2 Hz时,远场尾流的恢复速度大大提升。振幅为1°的纵摇工况中尾流区下游x = 15D处的尾流速度均与无纵摇工况基本一致,而振幅为4°的纵摇工况在尾流区下游x = 15D处的尾流恢复更快,尾流速度更接近来流水平。
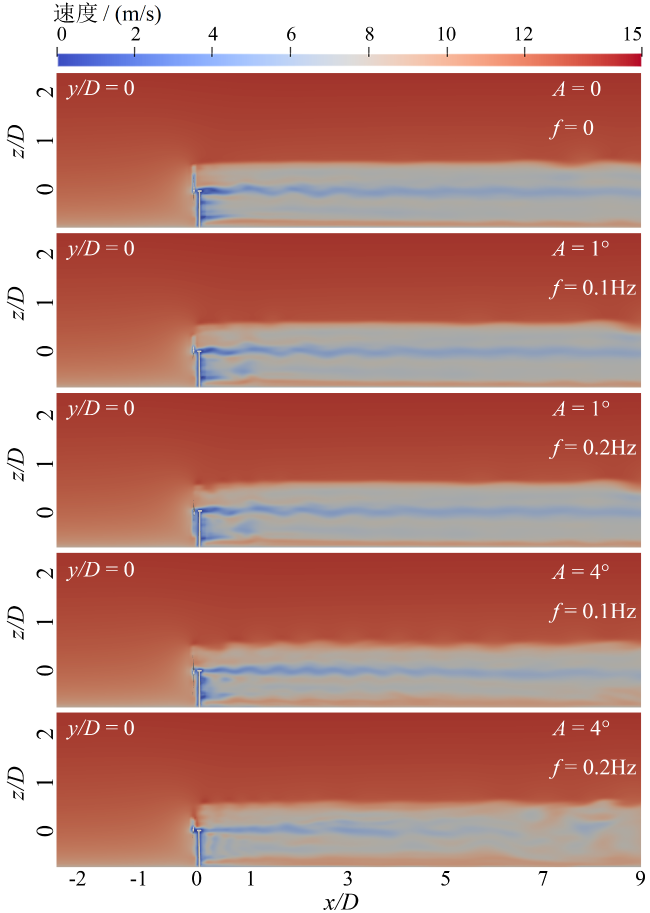
Fig. 9 The velocity contours of wind turbine wake at x-z plane图9 风力机尾流x-z截面速度云图 |
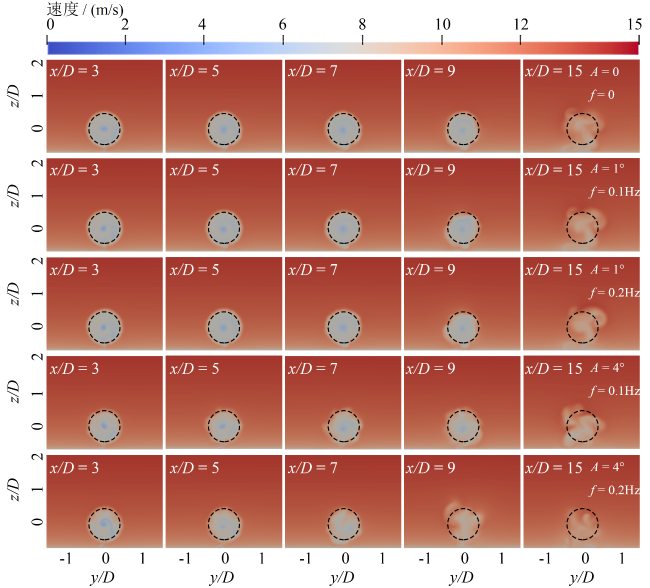
Fig. 10 The velocity contours of wind turbine wake at y-z plane图10 风力机尾流y-z截面速度云图 |
3 结论
基于OpenFOAM平台,采用计算流体力学数值模拟方法和重叠网格技术对纵摇运动状态下NREL 5MW风力机进行数值模拟,研究了海上漂浮式风力机尾流特性在纵摇工况中的动态变化,结论如下:
(1)通过对比无纵摇工况下风力机尾流的风速分布曲线与致动线法计算的风速分布曲线可以发现,致动线法由于未考虑机舱与塔柱的塔影效应,计算得到的尾流风速偏高,严重低估了尾流区内的风速亏损和尾流影响范围,高估了尾流风速的恢复速度和尾流的扩张角,且忽略了尾流风速由于叶片旋转出现不对称分布的情况。
(2)与无纵摇运动的风力机尾流相比,由于纵摇运动中叶轮对周围流场的扰动,纵摇工况下的风力机尾流恢复速度更快,且尾流恢复速度随着纵摇运动的频率和幅值增加而增加,其中在频率为0.2 Hz、振幅为4°的纵摇运动工况中尾流恢复速度最快,尾流扩散现象最明显。
(3)纵摇运动的振幅较小时,近场尾流的风速恢复会受到一定的影响,而对远场尾流影响不大;当振幅较大时,纵摇运动会加速全部尾流区域的风速恢复,并出现更为明显的扩散现象。至风力机下游x = 15D处时,所有工况中的尾流风速均基本恢复至来流水平。
(4)仅对海上浮式风力机六自由度运动中的纵摇运动进行了模拟,在实际运行中,由于风力机受六自由度运动耦合影响,尾流可能具有更快的恢复速度和更明显的扩散现象。
