

0 引言
由于环境污染和能源匮乏的压力,各国都在努力寻找新的能源和发展新的交通工具。作为新能源汽车的动力电源之一,锂离子电池被认为是当前最可靠的能源储存和转化装置[1,2,3]。传统层状正极材料如LiCoO2在实际充放电时最多只能脱出50%的Li+,当材料过充会发生结构塌陷,导致其失去原有的电化学活性[4,5],并且金属钴的成本较高,传统正极材料的这些不足使其很难满足高比容量和高能量密度电动车及电子产品的需求。2005年THACKERAY等[6]报道了xLi2MnO3∙(1-x)LiMO2 (M = Mn, Ni, Co等)富锂层状材料,在2 ~ 5.0 V电压范围内可释放250 mA∙h/g的比容量,充电电压为4.6 V时,也可释放出200 mA∙h/g的容量。层状富锂氧化物正极材料包含Li2MnO3和LiMO2两种成分。LiMO2属于典型α-NaFeO2层状结构,六方晶系,$R\overline{\text{3}}m$ 空间点群。Li2MnO3属于单斜晶系,C2/m空间点群,其结构式或表示为Li[Li1/3Mn2/3]O2,代表过渡金属层中Mn的位置有1/3被Li占据,形成每个Li周围有6个Mn的LiMn6超晶格结构[7]。对富锂高容量的来源研究发现,除传统的层状结构中Li-O-M构型,还包含一个未杂化的Li-O-Li构型,在未杂化的构型中,阴离子氧参与电荷补偿,提供额外的容量[8]。分析充放电曲线发现,阴离子氧化还原需要在4.5 V以上进行,这就带来严重的界面副反应问题,而不可逆的氧析出又会导致循环性能下降[9]。为解决这些问题,学者们采用掺杂、表面包覆来抑制阴离子氧的活动及使用功能性添加剂来形成稳定的界面膜提高富锂正极材料的循环性能[10,11,12]。但关于其倍率性能的提高,至今仍无显著改进。人们尝试用小尺寸颗粒缩短Li+ 传输路径的方法来提高倍率性能,然而这会增加界面副反应,牺牲了循环性能。
研究发现,在锂离子的传输过程中,材料自身的层状结构是决定锂离子脱嵌的关键因素。层状结构的特性决定了Li+ 只能沿着平行于锂层的方向进行脱嵌。其中,垂直于c轴的为{001}平面,该平面主要由MnO6、NiO6和CoO6八面体组成,三种八面体通过共边的氧原子相互连接,形成一个密闭结构,Li+ 不能在此平面脱嵌。因此,密排{001}平面为电化学非活性平面。相对而言,垂直于{001}平面的{010}晶面族具有开放的Li+ 扩散通道,Li+ 能够沿{010}平面的a轴或b轴方向进行扩散、脱嵌[13]。因此制备高{010}晶面族暴露的富锂材料可兼具循环及倍率性能。然而在晶体生成过程中,具有较高表面能的{010}晶面容易消失,生长的晶体表面主要以低能平面为主[14],如何阻止其消失,研究者们采取了一系列的方案。例如,CHEN等[15]采用微乳液反应,利用表面活性剂吸附作用获得了{010}晶面暴露的材料。XU等[16]采用水热反应,利用CO2吸附在{010}晶面,阻止该晶面的生长。但上述方案不适合大规模生产,因此用普适性方法成功合成具有高暴露{010}晶面的富锂层状材料仍是一个挑战。
本文提出一种前驱体-模板法,通过调控共沉淀时间,为增加(010)纳米板的产率,使得前驱体纳米板在 [010] 和 [001] 方向上同时生长,使制备的前驱体具有花状形貌,混锂烧结后,前驱体的形貌得以保留,合成具有高暴露 {010} 晶面的富锂层状材料Li1.17Ni0.4Co0.05∙Mn0.38O2,同时,为研究高暴露{010} 晶面对材料电化学性能,循环稳定性的影响,对原始材料和高暴露{010}晶面的富锂层状材料的结构、形貌和电化学性能进行比较研究和讨论。
1 实验部分
1.1 材料制备
采用共沉淀法制备Ni0.48Co0.06 Mn0.46 (OH)2前驱体材料。实验试剂均为分析纯,无需进一步净化。以Ni(SO)4∙6H2O、Co(SO)4∙7H2O、Mn(SO)4∙H2O、NH3∙H2O和NaOH为原料。先称取摩尔比为0.48∶0.06∶0.46的Ni(SO)4∙6H2O、Co(SO)4∙7H2O和Mn(SO)4∙H2O溶于50 mL去离子水中,配制成浓度为2 mol/L的金属盐溶液。然后采用NaOH溶液(50 mL, 4 mol/L)作为沉淀剂,以30 mL氨水作为络合剂,将金属盐溶液和沉淀剂溶液按1 mL/min的流速泵入三颈烧瓶中。通过控制缓冲溶液流速,使pH稳定在11.00±0.1,反应温度为 (50±5)℃,搅拌速率为800 r/min。将沉淀完成的前驱体用去离子水以高速离心机(安徽嘉文仪器装备有限公司,JW-2019H)离心5次,除去残留离子,在120℃下真空烘干12 h。
称取一定质量沉淀9 h的前驱体,在马弗炉(安徽贝意克设备技术有限公司,MF-1200C)中以450℃保温5 h,待冷却至室温后,将其与LiOH·H2O(Li过量5%)按摩尔比1∶1.47进行充分研磨混合,以升温速率为3℃/min加热至850℃并保温12 h。冷却后得到具有高暴露{010}晶面的富锂层状材料Li1.17Mn0.38Ni0.4Co0.05O2(HLLO)。
作为对比,称取一定质量沉淀12 h的前驱体,其余制备方法同上。冷却后得到富锂层状材料Li1.17Ni0.4Co0.05 Mn0.38O2(LLO)。
1.2 材料的物化结构表征
所制备富锂层状材料的晶体结构由X射线衍射仪(X-ray diffractometer, XRD)(日本,Rigaku Ultima IV, CuKɑ)进行分析,扫描范围为10° ~ 80°,扫速为3°/min;采用扫描电子显微镜(scanning electron microscope, SEM)(美国,FEI,Quanta 250 FEG)、透射电子显微镜(transmission electron microscope, TEM)(美国,FEI,Talos F200X)及快速傅里叶变换(fast Fourier transform, FFT)(美国,FEI,Talos F200X)、拉曼光谱(德国,WITec,alpha300 R Raman)来观察富锂层状材料的形貌和微观结构。采用X射线光电子能谱(X-ray photo-electron spectroscopy, XPS)测试仪(日本,Kratos,AXIS SUPRA)检测元素价态。采用电感耦合等离子体测试(inductively coupled plasma, ICP)(德国,斯派克,SPECTRO ARCOS MV)对元素进行定量分析。
1.3 材料的电化学性能测试
1.3.1 电极制备
将活性材料、乙炔黑和聚偏氟乙烯黏合剂按8∶1∶1的质量比与N-甲基吡咯烷酮用脱泡搅拌机(日本,新基贸易有限公司,ARE 310)混合均匀,涂覆到铝箔上,在80℃真空烘箱保温1 h,再转移至120℃真空烘箱保温12 h,之后取出测量极片厚度,用辊压机(深圳市科晶智达科技有限公司,MSK-2150)辊压至原极片厚度的90%,裁成直径为12 mm的小圆片。
1.3.2 电池组装
扣式电池的组装在充满氩气的手套箱(德国,MBraun,MB-VOH-150)中进行,水含量 < 7.5 × 10⁻⁶ g/m3,氧含量 < 1 × 10⁻⁵ g/m3。采用CR2025型号扣式电池,依次放入负极壳、弹簧片、垫片、负极、隔膜、正极和正极壳,负极为锂片,隔膜为Celgard 2300聚乙烯膜,电解液为1 mol/L LiPF6溶液(碳酸乙烯酯、碳酸二甲酯、碳酸甲乙酯体积比为1∶1∶1),不加任何电解液添加剂。
1.3.3 电池测试
采用蓝电测试系统(武汉市蓝电电子股份有限公司,LAND CT 2001A)对原始材料和改性材料组装而成的扣式电池进行充放电测试。电压范围为2.0 ~ 4.65 V,温度为25℃,倍率测试区间为0.1 ~ 4 C(1 C = 200 mA∙h/g)。
2 结果与讨论
阻止高暴露晶面的生长是合成HLLO的决定性因素,但随着共沉淀反应时间的延长,由于热力学的平衡作用生成低能{001}晶面前驱体。为获得具有高暴露{010}晶面的前驱体,在共沉淀过程中,必须考虑反应时间。前驱体的形貌变化可用作反应时间对其影响的判断,在经过不同的沉淀时间后,从烧瓶中提取少量前驱体进行SEM分析。图1a ~ 图1d 分别是经过3 h、6 h、9 h、12 h沉淀后前驱体的SEM图。可以看出,反应3 h生成的前驱体颗粒大小不一,归因于反应初期,体系中沉淀物以成核为主,部分小颗粒团聚成胶状,造成形貌不均匀。反应6 h生成的前驱体部分颗粒整体明显变大,但仍存在小颗粒,同时,相较于反应3 h的前驱体材料,经过6 h的沉淀后前驱体材料表面开始呈现花状结构。当反应达到9 h时,呈现出由纳米片组成的花状结构,且碎小的颗粒基本消失,这些纳米片的存在不仅有利于锂离子在高温煅烧中的扩散,同时为晶体的生长预留了足够的空间。反应达到12 h时,前驱体的纳米片逐渐被覆盖并呈现出球状结构。从能量角度分析,球状的形貌具有最低的表面自由能,同时由于在搅拌剪切力的作用下,部分未成核的纳米片再次被打散,覆盖在材料表面,前驱体颗粒进一步长大。
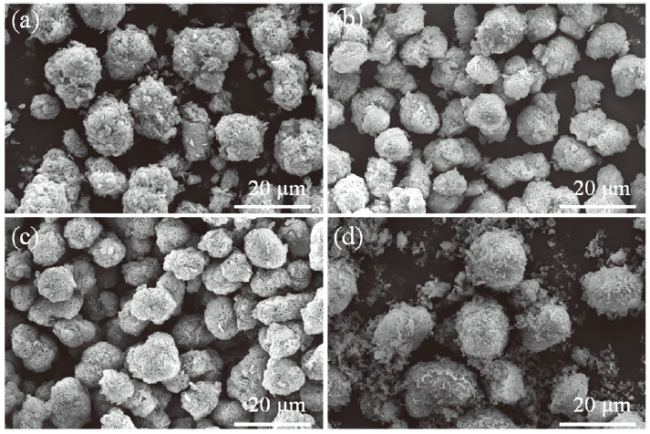
Fig. 1 SEM images of precursors with different reaction times: (a) 3 h; (b) 6 h; (c) 9 h; (d) 12 h图1 不同反应时间制备前驱体的SEM图:(a)3 h; (b)6 h;(c)9 h;(d)12 h |
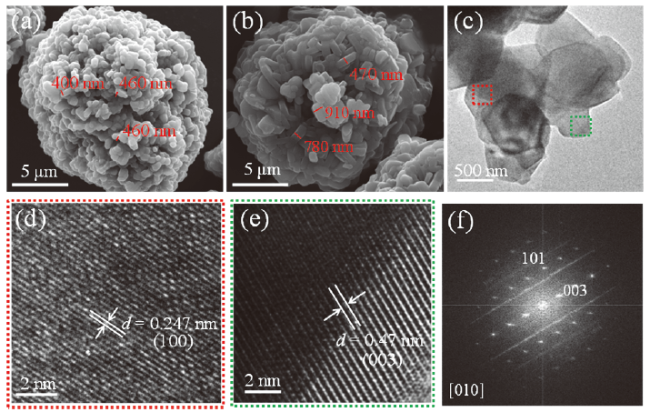
Fig. 2 (a) SEM image of LLO; SEM image (b), TEM image (c), top (bottom) plane HRTEM image (d), side HRTEM image (e) and FFT image (f) of HLLO图2 (a)LLO的SEM图;HLLO的SEM图(b)、TEM图(c)、顶(底)部平面HRTEM图(d)、侧面HRTEM图(e)及FFT图(f) |
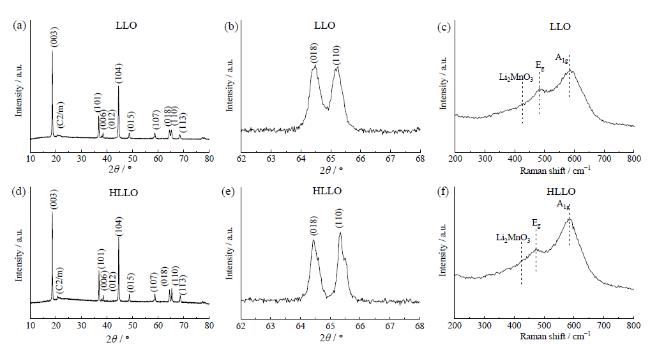
Fig. 3 XRD spectrum (a, b) and Raman spectrum (c) of LLO; XRD spectrum (d, e) and Raman spectrum (f) of HLLO图3 LLO的XRD图谱(a、b)和拉曼光谱(c);HLLO的XRD图谱(d、e)和拉曼光谱(f) |
Table 1 Composition analysis of LLO and HLLO materials by ICP表1 ICP分析LLO和HLLO材料的成分 |
| Sample | Content / % | |||
|---|---|---|---|---|
| Li | Mn | Ni | Co | |
| LLO | 1.169 | 0.381 | 0.412 | 0.051 |
| HLLO | 1.171 | 0.379 | 0.401 | 0.049 |
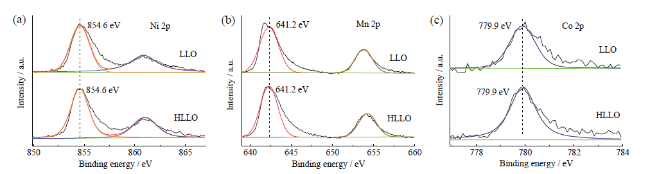
Fig. 4 XPS spectra of the LLO and HLLO samples: (a) Ni 2p; (b) Mn 2p; (c) Co 2p图4 LLO样品和HLLO样品的XPS图谱:(a)Ni 2p;(b)Mn 2p;(c)Co 2p |
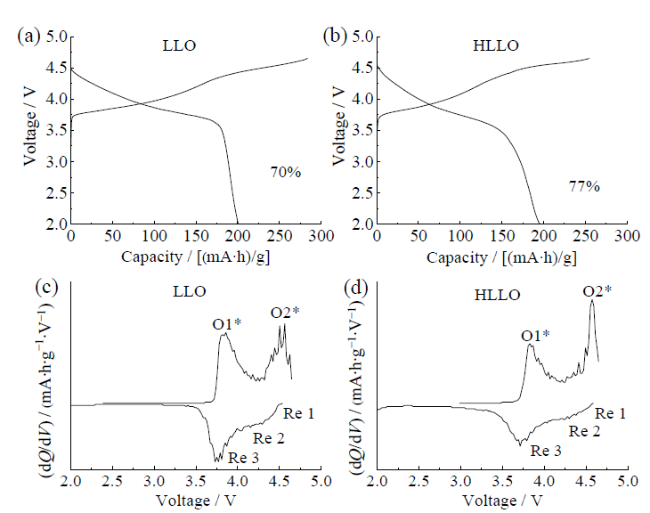
Fig. 5 Typical initial charge-discharge curves of LLO (a) and HLLO (b) at 0.1 C; dQ/dV profiles of LLO (c) and HLLO (d)图5 LLO(a)和HLLO(b)样品在0.1 C倍率下的首圈充放电曲线;(c、d)对应首圈充放电的微分电容曲线 |
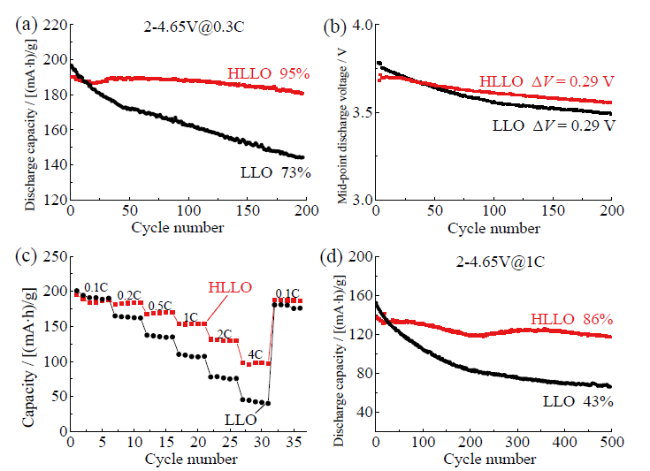
Fig. 6 (a) Cycle performance of LLO and HLLO after 200 cycles at 0.3 C; (b) median voltage change curve during cycling; (c) rate performance; (d) cycle performance of 500 cycles at 1 C图6 (a)LLO和HLLO样品在0.3 C倍率下循环200周曲线图;(b)循环过程中中值电压变化曲线;(c)倍率性能图;(d)1 C倍率下循环500周曲线图 |
Table 2 The data of cycling performance for the LLO and HLLO samples at 0.3 C and 1 C rate (2.0 - 4.65 V)表2 LLO和HLLO样品在0.3 C和1 C下的循环性能数据(2.0 ~ 4.65 V) |
| Sample | Condition | Specific capacity / (mA∙h/g) | Capacity retention / % |
|---|---|---|---|
| LLO | 0.3 C, 1st | 197 | 73 |
| 0.3 C, 200 th | 144 | ||
| 1.0 C, 1 st | 152 | 43 | |
| 1.0 C, 500 th | 66 | ||
| HLLO | 0.3 C, 1 st | 190 | 95 |
| 0.3 C, 200 th | 181 | ||
| 1.0 C, 1 st | 137 | 86 | |
| 1.0 C, 500 th | 117 |
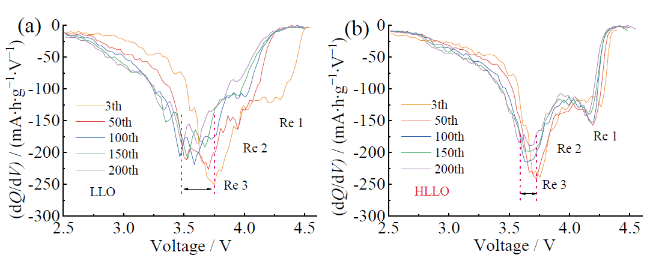
Fig. 7 dQ/dV profiles of LLO (a) and HLLO (b) for different cycles at 0.3 C图7 LLO(a)和HLLO(b)在0.3 C倍率下循环不同圈数的dQ/dV曲线 |
为进一步研究LLO和HLLO电化学性能的差异,对两种材料组装的扣式电池进行循环后阻抗测试。图8a 为等效电路图,图8b 和图8c 为循环200周后的阻抗拟合图,表3为具体拟合数值。等效电路中,Rf为界面膜电阻,Rct为电荷传递电阻。经过200周循环后,LLO材料Rct值为350.3 Ω,Rf值为112.6 Ω,而HLLO材料Rct值和Rf值分别为100.2 Ω和17.3 Ω,这是由于随着充放电的进行,LLO材料表面生成大量固体电解质界面(solid electrolyte interphase, SEI)膜,同时由于电解液的侵蚀在材料表面生成大量无序岩盐相,阻碍锂离子的迁移,从而导致LLO材料的Rf和Rct值较大,而HLLO材料中具有高暴露{010}晶面存在,拥有大量锂离子扩散路径,因此其电阻的增长值小于LLO材料。为了确定材料的锂离子扩散系数DLi+,采用如下公式进行计算[33]:
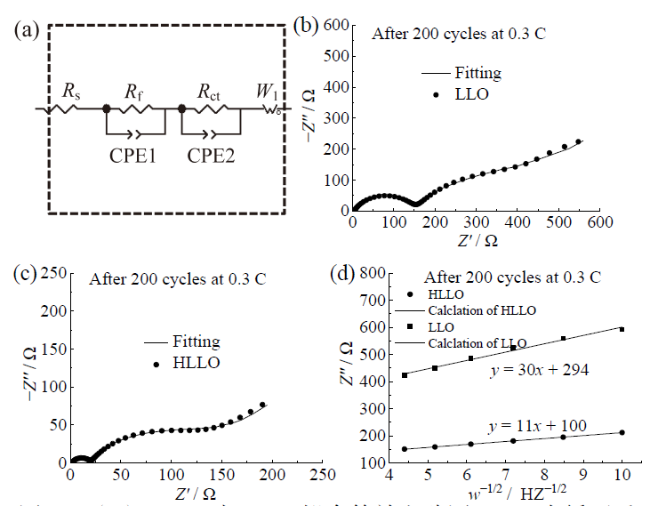
Fig. 8 (a) Fitted equivalent circuit diagram of HLLO and LLO; electrochemical impedance spectra of LLO (b) and HLLO (c) after 200 cycles; (d) the curve comparison of the real impedance Z″ versus ω-1/2 and corresponding linear fitting图8 (a)HLLO与LLO拟合等效电路图;200次循环后LLO(b)和HLLO(c)材料的交流阻抗谱;(d)实部阻抗Z″ 与ω-1/2的曲线比较 |
${{D}_{\text{L}{{\text{i}}^{\text{+}}}}}=\frac{{{R}^{2}}{{T}^{2}}}{2{{n}^{4}}{{A}^{2}}{{F}^{4}}{{C}^{2}}{{\sigma }^{2}}}$ (1)
Table 3 Fitting parameters for electrochemical spectra of LLO and HLLO after 200 cycles表3 LLO和HLLO样品在循环200圈后阻抗测试的拟合结果 |
| Sample | Rs / Ω | Rf / Ω | Rct / Ω | DLi+ / (cm2/s) |
|---|---|---|---|---|
| LLO | 2.4 | 112.6 | 350.3 | 9.5×10⁻¹⁴ |
| HLLO | 2.1 | 17.3 | 100.2 | 3.9×10⁻¹³ |
式中:R为气体常数,8.314 J/(K∙mol);T为绝对温度,K;n为每个分子的得失电子数;A为电极和电解液接触面积,cm2;F为法拉第常数,96 500 C/mol;C为Li+ 的活性浓度,mol/L;σ为韦伯阻抗的斜率。通过计算得知锂离子在LLO和HLLO材料中的扩散系数分别为9.5×10-14 cm2/s和3.9×10-13 cm2/s,进一步证明了高暴露{010}晶面可以提高锂离子的扩散动力学。
为探究电极材料在循环后的相变情况,对循环200周的极片进行了XRD和TEM测试。如图9a 和图9b 所示,在0.3 C倍率下循环200周后LLO和HLLO都能够保持原本的层状结构。通过比较发现LLO和HLLO的I(003)/I(104)值分别是0.85和1.1[21],这说明HLLO材料具有更低的阳离子混排,锂离子脱嵌更加容易。图9c 和图9d 更直观地反映出,经过循环后LLO材料中有更多的无序岩盐相出现,从而导致在循环过程中锂离子迁移的数量较少,材料的循环稳定性更低,电压降更严重。
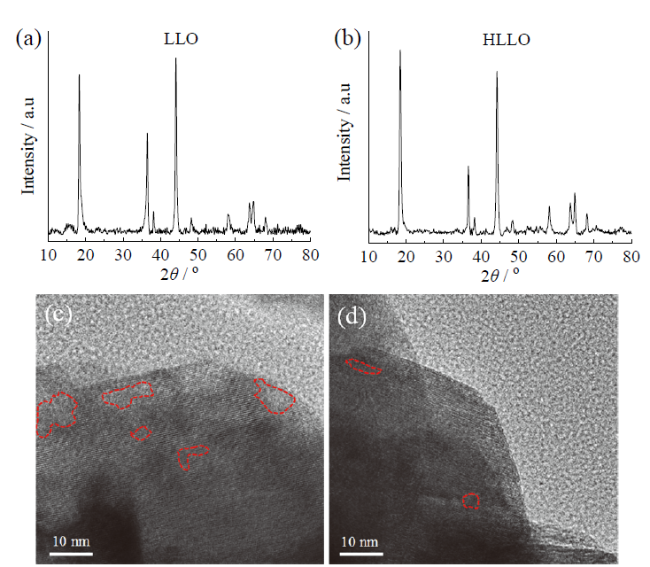
Fig. 9 XRD patterns of LLO (a) and HLLO (b), HRTEM patterns of LLO (c) and HLLO (d) after 200 cycles at 0.3 C图9 在0.3 C循环200周后的LLO(a)、HLLO(b)的XRD图,LLO(c)、HLLO(d)的HRTEM图 |
3 结论
采用前驱体-模板法及后续高温嵌锂合成了具有高暴露{010}晶面的Li1.17Ni0.4Co0.05Mn0.38O2富锂层状正极材料。结果表明,沉淀反应9 h的Ni0.48Co0.06Mn0.46(OH)2前驱体的形貌最佳,制备出的Li1.17Ni0.4Co0.05Mn0.38O2材料具有优异的倍率性能和循环性能,0.3 C下循环200周后具有181 mA∙h/g的可逆容量,容量保持率为95%,在1 C倍率下长循环500周后容量保持率仍有86%。归因于高暴露{010}晶面的存在可以提供无阻碍的锂离子扩散通道,有利于锂离子的快速脱嵌。
