

0 引言
从技术角度看,风能开发应优先选择沿海以及平原地区。此类地区地形平坦,风场具有高风速且低脉动的特点,适合风电场建设[5]。但是此类地区往往人口密集,风电场建设存在用地紧张、风机噪声污染等问题[6]。随着风能行业的快速发展,目前常规地形的风电场建设日趋饱和。复杂地形林业生态区因其丰富的风能资源逐渐受到人们的关注,已成为大规模部署风力机的备选方案。相对于沿海地区和平原地区,林业生态区通常处于具有复杂地形的山区,地形地貌的起伏变化使得区域内风场具有高度复杂性,单纯通过现场实测难以体现区域内整体风场特性[7]。此外,林业生态区地表具有丰富的植被类型,且存在着以年为周期的季节性生长变化[8]。森林冠层的存在会影响林区的地面与大气之间热量、水分和动量等的交换,从而极大地影响近地面风场,使得林区风特性(如平均风特性、湍流度等)与传统风能开发区域风特性具有显著差异,这可能会影响风力涡轮机的发电工作状态[9,10]。然而目前关于林区风能评估的研究还比较少见。
传统的风能评估方法是基于测风塔长期观测资料进行统计分析。对于诸如林业生态区等复杂地形,测风设备安装存在诸多困难。而且少数离散测风点无法反应区域内整体风场特性,加之测风塔测风存在经济性差、实施周期长等不足,因此现场实测并不是当前风能评估的首选方法[11]。近年来随着计算机技术的快速发展,数值模拟逐渐成为替代实验方法的有效手段。特别是能实现区域风场模拟的中尺度气象数值预报模式,因其对复杂地形的高度适应性以及计算高效性,被广泛应用于区域尺度的风场模拟和风能评估研究中。就近地风场的形成机制而言,自然风源于太阳辐射引起的自然对流和地球自转产生的克氏力作用,在近地层中,自然风受地表及其附着物的摩擦和扰动表现出低风速、高脉动的特性。因此,应用气象模式模拟一方面要从大尺度上能够准确重构太阳辐射等大尺度物理过程,另一方面应准确体现出地表冠层对风场的阻碍作用。天气研究与预报(weather research and forecasting, WRF)模式是目前应用最为广泛的中尺度数值预报模式,其以全球气象观测网络数据作为初始条件和边界条件,同时根据地形地貌与大气之间的交互作用,针对各种大气物理过程开发出相应的参数化方案,且各个参数方案均具有多种选项以适应不同需要的模拟过程。该模式在风场模拟与风能评估领域已获得成功应用。汪明军[11]利用WRF模式对长三角地区某一时间段的风场进行了数值模拟,并确定了适用于长三角区域的WRF参数设置,结果表明WRF模式适用于长三角地区的风能评估。杨明祥等[12]应用WRF模式对山东省南四湖周边地区的风能资源进行了初步评估,模拟结果显示该地区风能资源具备一定的开发利用价值。对于林业生态区,地形往往连绵起伏,加之植被生长周期影响,使得近地风场特性更为复杂。文献[13,14]表明WRF模式对于生态区的风场模拟表现出季节性差异。因此,如何设置参数化方案选项反映林区气象特征,并准确反映森林冠层对近地风场的作用,是应用WRF模式进行风能评估的关键。
本文针对黑龙江省帽儿山林区,采用WRF模式模拟复杂地形林区风场,通过对比模拟结果与现场雷达实测数据确定最优的参数化方案,重点考虑林木季节性生长对森林冠层的影响,应用本地化具有季节特征的森林冠层特征参数改进林业生态区的风场模拟,最后基于改进的模拟结果评估该地区的风能分布特性。
1 研究方法与资料
1.1 研究区域和激光雷达实测数据
黑龙江省帽儿山林区位于我国东北部季风区,属温带大陆性季风气候,该地区冬季寒冷漫长,夏季短暂且温热多雨,风向季节性变化明显。帽儿山地区属长白山山脉张广才岭的余脉,全区地貌属低山丘陵区,平均海拔300 m,最高海拔805 m。境内森林资源丰富,林木类型以阔叶林和混交林为主,主要树种包括杨树林、白桦林和紫椴林等[15],平均森林覆盖率为95%,平均树高为16 m。研究区域内林木植被在5月开始展叶,7月初林木植被最为茂盛,落叶期为8月底至10月初,其余时间内林木为无叶状态。
现场实测在帽儿山林区中心位置的东北林业大学森林生态观测站进行,实测设备为大气边界层激光雷达(见图1)。该激光雷达在水平状态下通过向天空垂直发射微米级激光信号,基于光学脉冲相干多普勒频移检测原理,利用大气中气溶胶的激光后向散射信号和激光发射系统的本振光做外差检测,获得两束光的外差信号,进而得到多普勒频移计算径向风速,采用微型光束扫描系统反演风速和风向[16]。该雷达的最大垂直观测范围为20 ~ 320 m。在精度方面,激光雷达的不确定度小于0.2%,校正总偏差小于±1%。该激光雷达被安装在山坡处(127.66°E,45.40°N),测量距离地面50 ~ 200 m高度处的风速,采样频率为10 Hz。
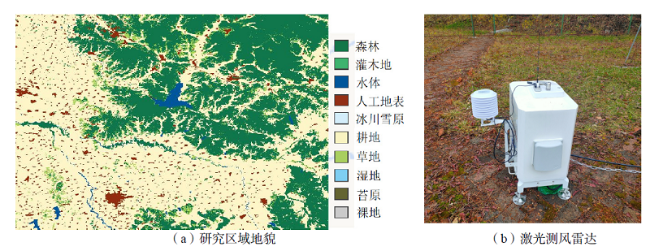
Fig. 1 The geomorphic characteristics of Maoer mountain and lidar图1 帽儿山地区地貌特征及研究中所使用的激光雷达 |
1.2 WRF模式设置
采用WRF(V4.0),模拟区域的中心点为(127.66°E,45.41°N),采用4重嵌套,如图2(a)所示,嵌套网格分辨率分别为9 km、3 km、1 km和333 m,相对应的网格数分别为202 × 202、218 × 218、218 × 218和218 × 218,模式垂直顶端气压为5 000 Pa,垂直层数为58。模式的气象观测数据为FNL/NCEP再分析数据。选用的主要物理参数化方案包括:WSM6微物理参数方案、Kain-Fritsch Cumulus Potential积云参数方案、RRTMG长波辐射方案和短波辐射方案、YSU行星边界层方案、Revised MM5表面方案。
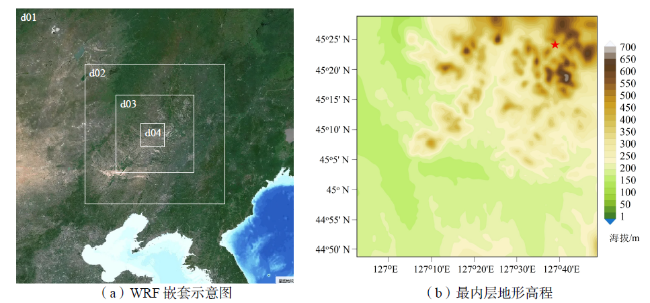
Fig. 2 The simulation region and the innermost domain (d04) (star indicates the location of lidar)图2 WRF模拟区域及最内层d04区域(星号为激光雷达安装位置) |
Table 1 The setup of land surface scheme表1 陆面方案工况设置结果 |
| 工况 | 陆面方案 |
|---|---|
| 工况1 | Noah |
| 工况2 | RUC |
| 工况3 | Noah-MP |
Table 2 The default and modified LAI of deciduous broadleaf forest and mixed forest in Noah-MP scheme表2 Noah-MP方案中落叶阔叶林和混交林的LAI默认值和修改值 |
| 月份 | LAI默认值 | LAI修改值 | ||
|---|---|---|---|---|
| 落叶阔叶林 | 混交林 | 落叶阔叶林 | 混交林 | |
| 1月 | 0.0 | 2.0 | 0.0 | 2.0 |
| 2月 | 0.0 | 2.0 | 0.0 | 2.0 |
| 3月 | 0.3 | 2.2 | 0.0 | 2.0 |
| 4月 | 1.2 | 2.6 | 0, 1.0 | 2.0, 2.5 |
| 5月 | 3.0 | 3.5 | 2.0, 4.5 | 3.0, 4.5 |
| 6月 | 4.7 | 4.3 | 5.0, 6.0 | 5.0, 6.0 |
| 7月 | 4.5 | 4.3 | 6.0 | 6.0 |
| 8月 | 3.4 | 3.7 | 6.0, 5.0 | 6.0, 5.0 |
| 9月 | 1.2 | 2.6 | 4.5, 2.0 | 4.5, 3.0 |
| 10月 | 0.3 | 2.2 | 1.0, 0 | 2.5, 2.0 |
| 11月 | 0.0 | 2.0 | 0.0 | 2.0 |
| 12月 | 0.0 | 2.0 | 0.0 | 2.0 |
注:林木展叶期和落叶期按上、下半月设置LAI。 |
Table 3 Configuration options for LAI and roughness length表3 LAI和粗糙长度的工况设计表 |
| 工况 | LAI值 | 粗糙长度值 |
|---|---|---|
| 工况3 | 默认值 | 默认值(0.8 m) |
| 工况4 | 修改值 | 默认值(0.8 m) |
| 工况5 | 修改值 | 修改值(2.0 m) |
| 工况6 | 修改值 | 修改值(3.0 m) |
根据文献[19]可知,林区粗糙长度与平均树高的关系可由公式(1)表示:
${{S}_{RME}}=\sqrt{\frac{1}{n}\sum\limits_{i=1}^{n}{{{\left( {{f}_{i}}-{{f}_{\text{ob},i}} \right)}^{2}}}} $ (1)
式中:Z0为粗糙长度;A0为相关系数,取值范围为0.02 ~ 0.2;H为平均树高。因此研究区域内粗糙长度的取值范围为0.32 ~ 3.2 m。根据粗糙长度的取值范围设定3种工况(工况4、工况5和工况6)(见表3),来确定合适的粗糙长度值。
此次模拟时间为2020年9月1日至2021年8月31日,根据研究区域内林木叶片的生长周期,将整个模拟期分为展叶期(4月中旬至6月中旬)、生长期(6月中旬至8月中旬)、落叶期(8月中旬至10月中旬)和无叶期(10月中旬至来年4月中旬),并选定5月、7月、9月和12月分别作为展叶期、生长期、落叶期和无叶期的代表月份。
1.3 误差分析方法及评估指标
通常采用均方根误差SRME、平均误差EM、相关系数R和平均相对误差EMR等指标评估风速模拟结果准确性[20]。相应计算公式如下:
${{S}_{\text{RME}}}=\sqrt{\frac{1}{n}\sum\limits_{i=1}^{n}{{{\left( {{f}_{i}}-{{f}_{\text{ob},i}} \right)}^{2}}}} $ (2)
${{E}_{\text{M}}}=\frac{1}{n}\sum\limits_{i=1}^{n}{\left( {{f}_{i}}-{{f}_{\text{ob},i}} \right)} $ (3)
$R=\frac{\sum{_{i=1}^{n}\left( {{f}_{\text{ob},i}}-{{{\bar{f}}}_{\text{ob},i}} \right)\left( {{f}_{i}}-{{{\bar{f}}}_{i}} \right)}}{{{\left[ \sum{_{i=1}^{n}{{\left( {{f}_{\text{ob},i}}-{{{\bar{f}}}_{\text{ob},i}} \right)}^{2}}\sum{_{i=1}^{n}{{\left( {{f}_{i}}-{{{\bar{f}}}_{i}} \right)}^{2}}}} \right]}^{{}^{1}/{}_{2}}}} $ (4)
$E_{\mathtt{MR}}=\frac{E_\mathtt{M}}{\frac1n\sum_{i=1}^nf_{\mathtt{ob},i}}$ (5)
式中:i为时间点;n为模拟周期内的时间点总数;fi和fob,i分别为某一时间点的模拟结果和观测结果;${{\bar{f}}_{i}}$和 ${{\bar{f}}_{\text{ob,}i}} $分别为模拟结果和观测结果平均值。
威布尔分布概率模型常被用来统计风速的概率分布,是风能评估分析的有效工具,其概率密度函数表达式为:
$\bar{w}=\frac{1}{2}\rho \int_{0}^{\infty }{{{v}^{3}}f(v)dv}=\frac{1}{2}\rho {{c}^{3}}\Gamma (\frac{3}{k}+1) $ (6)
式中:k和c为威布尔分布的两个参数;k为形状参数,表示分布函数的峰值情况;c为尺度参数,反映风电场的平均风速。
平均风功率密度的计算公式为:
$\bar{w}=\frac{1}{2}\rho \int_{0}^{\infty }{{{v}^{3}}f(v)\text{d}v}=\frac{1}{2}\rho {{c}^{3}}\Gamma \left( \frac{3}{k}+1 \right) $ (7)
式中:ρ 为空气密度,kg/m3,空气密度一般情况下为定值1.225 kg/m3;v为风速,m/s; $\bar{w} $为平均风功率,W/m2。
有效风功率密度是评价某地区风能资源是否值得开发的重要指标。一般来说,风力机工作时的最小临界风速为3 m/s,最大临界风速为25 m/s,因此有效风功率密度 ${{\bar{w}}_{3}} $的计算公式为:
${{\bar{w}}_{3}}=\frac{1}{2}\rho \int_{3}^{25}{{{v}^{3}}f(v)\text{d}v} $ (8)
2 结果分析与讨论
2.1 WRF模拟验证
通过对比模拟风速与观测风速来验证不同森林冠层特征参数(LAI和粗糙长度)对模拟风速的影响。所使用的实测数据由激光雷达采集,采集高度为50 m、100 m和150 m。模拟结果采用距离雷达采集点最近网格点的风速,通过三次样条插值方法获得雷达采集高度的风速数据。
图3是50 m高度处有叶期和无叶期应用不同陆面方案风速模拟与实测统计指标。由图可见,当陆面方案为Noah-MP时(工况3),风速模拟值与实测值之间的SRME和EM最小,R最大,因此Noah-MP方案适用于复杂地形林区的风场模拟。
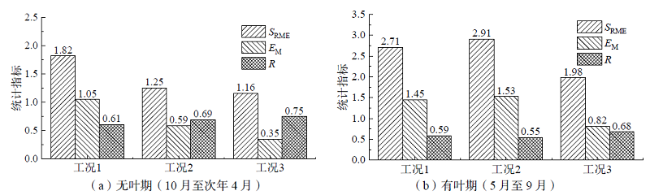
Fig. 3 The error parameter comparison of simulation and observation under different land surface schemes图3 不同陆面方案设置下风速模拟结果与实测结果的误差对比 |
如表4所示为LAI对模拟精度的影响结果。使用LAI修改值后,模拟风速逐渐接近观测风速,但模拟精度的提高程度随着高度的增加而减小。在50 m高度处,模拟风速与观测风速之间的EMR由25%降到23%,降幅为2%,而在100 m和150 m高度处降幅仅有1%。因此,本地化LAI数据对于提高风场模拟效果是有必要的。
Table 4 Comparison of wind speed at different heights under different LAIs (May 15th to 31st)表4 不同LAI(5月15日至31日)下不同高度风速的比较 |
| 离地高度/m | 平均观测风速/(m/s) | 风速/(m/s) | EMR/% | ||
|---|---|---|---|---|---|
| 工况3 | 工况4 | 工况3 | 工况4 | ||
| 50 | 3.42 | 4.29 | 4.19 | 25 | 23 |
| 100 | 4.38 | 5.56 | 5.52 | 27 | 26 |
| 150 | 5.21 | 6.50 | 6.45 | 23 | 24 |
通过表5可以看到粗糙长度对模拟精度的影响。与LAI相比,粗糙长度的改变对模拟精度的影响更加明显。当修改粗糙长度后(工况4和工况6),12月上半月时期的50 m高度处模拟风速与实测风速之间的EMR降幅达到17%,在5月下半月降幅达到26%。这种现象说明粗糙长度在提高林区近地面风速模拟方面是一个关键因素。同时也可以发现,粗糙长度的影响也是随着高度的增加而逐渐降低,两个时期内150 m高度处EMR降幅分别为5%和11%。因此,修改粗糙长度对于提高风场模拟精度是十分必要的。
Table 5 Comparison of wind speed at different heights under different roughness lengths表5 不同粗糙长度下不同高度风速的比较 |
| 时期 | 高度/m | 平均观测风速/(m/s) | 风速/(m/s) | EMR/% | ||||
|---|---|---|---|---|---|---|---|---|
| 工况4 | 工况5 | 工况6 | 工况4 | 工况5 | 工况6 | |||
| 12月1日至15日 | 50 | 2.30 | 2.67 | 2.41 | 2.27 | 16 | 5 | -1 |
| 100 | 3.51 | 4.19 | 4.01 | 3.91 | 19 | 14 | 11 | |
| 150 | 4.35 | 5.36 | 5.23 | 5.16 | 23 | 20 | 18 | |
| 5月15日至31日 | 50 | 3.42 | 4.19 | 3.78 | 3.31 | 23 | 11 | -3 |
| 100 | 4.38 | 5.52 | 5.20 | 4.78 | 26 | 19 | 9 | |
| 150 | 5.21 | 6.45 | 6.22 | 5.87 | 24 | 19 | 13 | |
综上可知,改进LAI和粗糙长度均能提高林区风速模拟精度,但粗糙长度在提高模拟精度方面作用更大,且二者的作用均随着高度的增加而逐渐减弱。因此当考虑林区近地面(高度小于200 m)风场模拟时,应着重考虑LAI和粗糙长度这两个因素。
根据前述分析,在本地化森林冠层特征参数的基础上(工况6)进行了一整年的模拟。表6是四个代表月份不同高度处的模拟风速与观测风速的对比验证结果。可以从表6中看出,WRF模拟效果与所模拟的季节和离地面高度相关。在风速EM方面,WRF模型在冬季时模拟效果最好,此时各个高度的风速EM均比其他月份相同高度的值要小。在风速SRME方面,夏季时SRME最小,春季时最大,且随着高度的增加SRME增大。而在R值方面,春季时的R最大,同时除春季时期以外,其余季节的模拟风速与实测风速之间的相关系数均随着高度的增加而减小。结合以上3个指标的统计学意义分析:WRF模式在春季具有最大的相关系数,能够较好地体现林区风速的变化趋势,同时具有最大的平均偏差和均方根,说明其对春季风速总体高估。冬季则相反,具有最小的相关系数,且平均偏差和均方根较小。说明该模式对冬季风速模拟效果较好,但对其变化趋势的体现相对较低。夏季和秋季的统计指标居中。这主要是由于春季是林木枝叶旺盛生长时期,其柔软枝叶对风场的扰动较为明显。而夏秋两季枝叶相对茂盛,冠层的遮蔽效果明显。冬季树叶凋落,林木对风场的扰动减弱。WRF模式本身对森林冠层的扰动作用体现并不明显,这也是该模式作为中尺度模型在模拟小尺度物理过程时本身存在的不足。此外,研究区域冬季风速较高且稳定,春夏季降雨频繁,风速较低。WRF模式对复杂地形低风速的低敏感性也是造成误差季节性差异的重要因素[17]。
Table 6 Comparison and verification of simulated and observed wind speed表6 风速模拟值与观测值的对比验证 |
| 日期 | EM | SRME | R | |||
|---|---|---|---|---|---|---|
| 100 m | 150 m | 100 m | 150 m | 100 m | 150 m | |
| 2020年9月 | 0.65 | 0.57 | 1.95 | 2.08 | 0.52 | 0.50 |
| 2020年12月 | 0.12 | 0.35 | 1.82 | 2.27 | 0.62 | 0.53 |
| 2021年5月 | 0.81 | 0.87 | 2.47 | 2.62 | 0.69 | 0.71 |
| 2021年7月 | 0.77 | 0.71 | 1.57 | 1.68 | 0.65 | 0.62 |
表7是四个月份不同高度处的模拟风向与观测风向的对比验证结果。非生长季时的EM明显大于生长季,而SRME却呈现相反的规律,同时各个月份的风向EM和SRME在大部分情况下均随着高度的增加而减小。WRF模式在模拟生长季平均风向方面具有更好的性能,同时冬季和春季模拟风向相对于实测风向呈现逆时针偏差,夏季和秋季则相反。这主要是由于研究区域地形复杂,导致风向复杂多变。WRF模式地形地貌等静态数据本身分辨率较低,难以精确捕捉风向在复杂地形区域剧烈变化。当林区处于生长季时,林木枝叶茂盛,森林冠层作用明显,降低了复杂地形对近地风向的影响。
Table 7 Comparison and verification of simulated and observed wind direction表7 风向模拟值与观测值的对比验证 |
| 时期 | SRME | EM | ||
|---|---|---|---|---|
| 100 m | 150 m | 100 m | 150 m | |
| 2020年9月 | 71.35 | 63.02 | 6.04 | 8.89 |
| 2020年12月 | 38.73 | 34.65 | -22.65 | -15.85 |
| 2021年5月 | 70.01 | 60.20 | -5.45 | -2.98 |
| 2021年7月 | 79.57 | 70.25 | 2.11 | 1.35 |
通过以上综合分析可知,本地化森林冠层特征参数有助于提高WRF模拟风速精度,但是仍存在一定的误差。一方面该误差与所模拟的时间段有关,不同时段林木的枝叶状态差异明显,其对风场的扰动作用同样差异较大;另一方面是林区地形的复杂,对风向影响明显,从而降低WRF风场模拟精度。同时WRF模拟风速、风向精度随着高度的增加而提高,这是由于随着高度的升高,复杂地形和林木植被对近地面风场的影响逐渐减弱。作为中尺度气象模式,WRF在模拟小尺度物理过程时具有自身尺度限制。通过结合本地化森林冠层特征参数,该模式能较好地重现复杂地形林业生态区一年四季的风速和风向。
2.2 风能评估
基于林区风场模拟结果,对雷达观测点150 m高度处的威布尔分布参数进行计算评估。从图4中可以看到,相对于观测风速威布尔曲线,模拟风速威布尔曲线明显向右侧移动,这表明模型低估了低风速频率而高估了高风速频率,导致对总体观测风速的高估。模拟与观测风速的形状参数k和尺度参数c均较为接近,k值与c值的相对误差分别为12.5%和15.7%,相对误差值在可接受范围内。
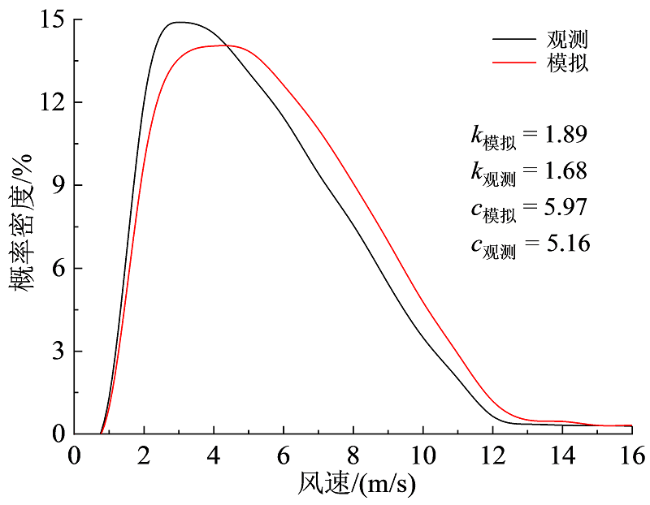
Fig. 4 Weibull distribution curve of simulated and observed wind speed at 150 m height at lidar location图4 雷达观测点150 m高度处模拟与观测风速威布尔分布曲线图 |
图5(a、b)表明激光雷达点处的风能与离地高度和季节相关。可以发现,年平均风功率密度和有效年平均风功率密度均随着高度的增加而逐渐增大,在150 m高度时表现出稳定且可利用的风能资源;同时,不同高度各个季节的风能密度差异明显,春季时期的年平均风功率密度最大,而秋季最小。随着高度的升高,不同季节之间的风能密度绝对差值逐渐增大,而相对差异逐渐减小。这是由于在高度较低时,各个季节风能均较低。
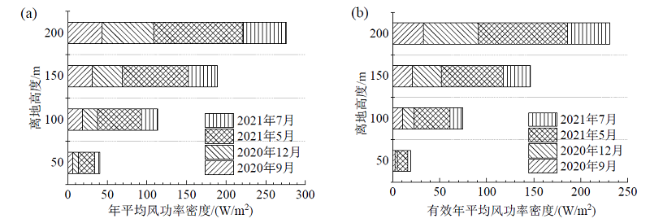
Fig. 5 Vertical and seasonal distribution characteristics of wind power图5 风能垂直分布及季节分布特征图 |
结合图2(b)和图6可以发现,研究区域及周围地区的风能并非均匀分布,且与地形有密切关系。首先,相对于林业生态区,周围耕地区域为平原地区,该区域拥有整个研究区域内最大风能,且差异显著。其次,在复杂地形林区内,离地面50 m高度的风能分布极为复杂,年平均风功率密度值在0 ~ 300 W/m2之间不均匀分布且低密度值分布较广。再次,林区周围地区的风能水平分布不均,部分地区之间的风功率密度值变化幅度较大。随着高度逐渐升高,风功率密度的水平分布差异减弱。当高度为150 m时,地形起伏对风能分布影响减弱,整个林区风能分布相对均匀。最后,通过图2(b)可以发现最内层嵌套域地形变化规律是北部海拔最高且地形复杂,中部及南部海拔较低且地形平坦,而图6显示在同一高度处,北部风功率密度较小,中部最大,风能水平分布与地形存在一定相关性。随着高度的增加,平均风功率密度丰富且分布稳定。因此,在未来风电场建设时,可将风力机布置在林区山脊线处,通过提高安装高度以获得平稳且丰富的风能资源。
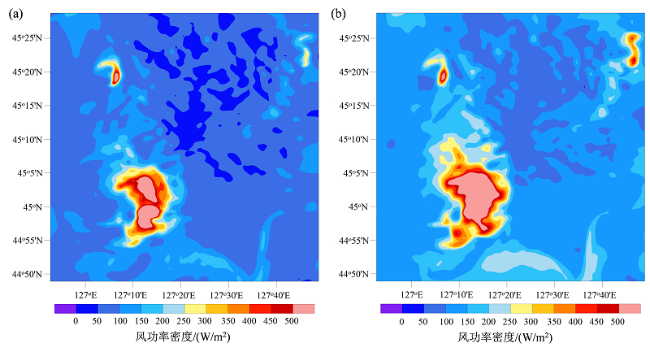
Fig. 6 Annual average wind power density distribution at the height of 50 m (a) and 150 m (b) in the innermost nested area图6 最内层嵌套域50 m(a)和150 m(b)高度处年平均风功率密度分布图 |
3 结论
基于WRF模型通过修正森林冠层参数对复杂地形林业生态区的风场进行数值模拟,结合雷达实测数据,对复杂地形林业生态区的风能资源进行评估。主要结论如下:
(1)WRF模式陆面方案表征地表冠层与上层大气之间的热质交换与动量交换过程。Noah-MP方案能够反映森林冠层中林木枝叶的季节性生长变化,比Noah方案和RUC方案具有更好的模拟性能,具有较好模拟效果。
(2)森林冠层特征参数(叶面积指数和粗糙长度)是影响林区风场数值模拟准确性的重要因素。相较于叶面积指数,粗糙长度对风场的影响更为显著,且二者对风场的影响均随着高度的增加而逐渐降低。
(3)复杂地形林业生态区风能存在明显时空差异性,春季的风能资源最为丰富且随高度的增加而逐渐增大。当高度达到150 m后开始表现出稳定且可利用的风能资源。风能水平分布与地形地貌密切相关,地形地貌越复杂,风功率密度越低。
(4)我国林区面积广阔,风能资源丰富,发展林区高精度数值气象预报技术对我国风能开发利用具有实际意义。通过引入本地化森林冠层特征参数可有效提高林区风场模拟的可靠性与风能评估的有效性,从而为风电产业的健康发展提供技术支撑。
