

0 引言
餐厨垃圾有机质含量高,蛋白质、碳水化合物及脂肪的含量丰富,通过厌氧消化处理产生沼气是目前餐厨垃圾的主要处理方式[1,2]。有机物厌氧分解通常会伴随着H2S的生成,在利用沼气时需要将H2S去除。向厌氧反应器内的顶部空间(顶空)通入适量的空气,在内置的生物载体上发生H2S的生物氧化,可将H2S高效去除。这种反应器内的生物脱硫方法已在沼气发酵工程上得到广泛应用。在进行反应器内的生物脱硫时,沼气在反应器顶空的停留时间是影响H2S去除效率的重要因素。在农业沼气项目中,原料的降解率通常较低,发酵时间长,负荷低。在超过5 h的沼气顶空停留时间条件下,选择合适的通气强度,通常可以实现较高的H2S去除效率[3,4]。餐厨垃圾高温厌氧消化工艺的容积产气率相对较高,文献报道的沼气顶空停留时间可短于4 h[5,6,7],较短的停留时间不利于高效去除H2S。原位生物脱硫工艺能否高效去除餐厨垃圾高温厌氧产生的H2S有待实验验证。同时,原位生物脱硫过程还可以提升有机酸的分解效率,增强反应器运行的稳定性[8,9]。然而,如果空气通入不当,反而会破坏厌氧消化过程的进行。因此,在进行反应器内的生物脱硫时,选择适当的过量空气倍数至关重要。
采用全混式厌氧反应器在高温条件下处理餐厨垃圾,通过开展长期连续运行实验,探究不同有机负荷、空气量和沼气顶空循环对H2S去除效果的影响,同时考察在不同工况下容积产气率和有机酸浓度的变化,分析厌氧工艺的稳定性和产气效能的提升效果。本研究可为优化原位生物脱硫工艺在餐厨垃圾高温厌氧处理过程中的应用提供参考。
1 材料与方法
1.1 实验装置与材料
运行对照和脱硫两个全混式厌氧反应器,每个反应器的总容积为6 L(有效容积4 L),放置于50 ℃恒温水浴槽内。反应器采用连续机械搅拌。在脱硫反应器内,将网状载体置于发酵液的液面上方,通过气体蠕动泵将微量空气泵送至载体和液面之间,载体上的硫氧化细菌在有氧条件下氧化H2S,生成单质硫沉淀,达到脱除H2S的目的。反应器的进料为某餐厨垃圾处理工程经分拣、破碎、制浆、高温除油和三相分离后的浆料。
1.2 运行条件
脱硫反应器发酵运行条件与空气通入条件如表1所示,实验运行了230 d,其中采用了15和10 d两种不同的水力停留时间(hydraulic retention time, HRT),对应的有机负荷率(organic loading rate, OLR)分别为7.1和10.5 kg/(m3∙d)(以COD质量计)。根据通气量的调整,实验分为四个阶段。第一、三和四阶段的HRT为15 d,第二阶段的HRT为10 d。反应器运行的第1 ~ 20 d为反应器的启动时间,随后进行针对脱硫反应器的通入空气脱硫实验。采用微型蠕动泵以连续定流量的方式将空气注入脱硫反应器顶空。第一阶段和第二阶段的空气通入量为理论需氧量的5倍,大约为沼气产量的1%。在第三阶段测试了HRT为15 d条件下2 ~ 5倍空气通入量的H2S去除效果,并在第四阶段测试了沼气循环对H2S去除的提升作用。沼气循环的具体操作为在气袋和脱硫反应器中间设置气泵,将气袋中实时收集的沼气连续泵入反应器顶空,空气通入和沼气循环同时进行,在一个进料周期内将当日产气量以恒定速率循环一次。对照反应器除不通入空气外,其余条件与脱硫反应器相同。
Table 1 The operating conditions for the desulfurization reactor during fermentation and the air injection conditions表1 脱硫反应器发酵运行条件与空气通入条件 |
| 运行阶段 | HRT/d | 运行天数/d | OLR/ [kg/(m3∙d)] | 空气通入量V1/(mL/d) | 空气通入流速/(mL/min) | 过量空气 倍数A① | 沼气 循环量② |
|---|---|---|---|---|---|---|---|
| 第一阶段 | 15 | 21 ~ 72 | 7.1 ± 0.7 | 200 ~ 240 | 0.14 ~ 0.17 | 5 | / |
| 第二阶段 | 10 | 73 ~ 173 | 10.5 ± 0.6 | 360 ~ 420 | 0.25 ~ 0.29 | 5 | / |
| 第三阶段 | 15 | 174 ~ 200 | 7.1 ± 0.7 | 144、216、288、360 | 0.10、0.15、0.20、0.25 | 2、3、4、5 | / |
| 第四阶段 | 15 | 201 ~ 230 | 7.1 ± 0.7 | 216 | 0.15 | 3 | 1 |
① A = V1/V0,其中V0表示进行原位生物脱硫时,去除H2S所需的全部生成单质硫所消耗的空气量,为理论空气通入量; ② 沼气循环量 = 日循环沼气量/日产沼气量。 |
1.3 化学分析方法与数据处理
沼气体积采用湿式气体流量计(北京金志业,LML-2)进行测定,沼气组分使用气相色谱仪(日本,岛津,GC-8A)检测,色谱柱为Φ 10 m × 2 mm不锈钢色谱柱,载气为氢气,载气流速为 20 mL/min,进样体积为0.5 mL[10]。用pH计(德国,梅特勒-托利多,Orion 5-star)测量pH。总固体(total solid, TS)和挥发性固体(volatile solid, VS)采用重量法进行测试[11]。沼气中的H2S浓度通过H2S检测管(日本,Gastec,4H/4L)测定。化学需氧量(chemical oxygen demand, COD)测量方法参照HJ/T 399-2007水质化学需氧量的测定快速消解分光光度法,挥发性脂肪酸的浓度使用气相色谱仪(日本,岛津,GC-2010 Plus)测定[12]。采用一级动力学分析单次进料后反应器产沼气数据,并利用线性回归方法拟合一级动力学曲线,根据拟合结果对比对照反应器和脱硫反应器的产沼气速率。
2 结果与讨论
2.1 连续运行条件下H2S的去除效率
按照式(1),理论上按照氧化每摩尔H2S需要0.5摩尔O2通入空气,能够将沼气中的H2S全部转化为单质硫,如过量通入空气会生成SO42-。反应器内生物脱硫的生化过程如式(1)~ 式(3)所示。
$ \begin{array}{l} \mathrm{H}_{2} \mathrm{~S}+\frac{1}{2} \mathrm{O}_{2} \rightarrow \mathrm{H}_{2} \mathrm{O}+\mathrm{S}^{0} \\ \Delta G^{0}=-209.4 \mathrm{~kJ} / \mathrm{mol} \end{array}$ (1)
$ \begin{array}{l} \mathrm{H}_{2} \mathrm{~S}+\mathrm{O}_{2} \rightarrow \frac{1}{2} \mathrm{~S}_{2} \mathrm{O}_{3}{ }^{2-}+\mathrm{H}^{+}+\frac{1}{2} \mathrm{H}_{2} \mathrm{O} \\ \Delta G^{0}=-563.2 \mathrm{~kJ} / \mathrm{mol} \end{array}$ (2)
$ \begin{array}{l} \mathrm{H}_{2} \mathrm{~S}+2 \mathrm{O}_{2} \rightarrow \mathrm{SO}_{4}{ }^{2-}+2 \mathrm{H}^{+} \\ \Delta G^{0}=-798.2 \mathrm{~kJ} / \mathrm{mol} \end{array}$ (3)
本研究的HRT为15 d,沼气顶空停留时间仅为3.1 h,低于文献报道的最低沼气顶空停留时间(5 h),因此无法保证H2S的高效去除[17]。为应对该问题,将空气初始通入倍数设定为5倍。如图1所示,在第21 d向脱硫反应器中按照5倍需氧量通入空气,H2S体积百分数由0.11%逐渐下降,在脱硫反应器运行至第68 d时,稳定在0.04%左右,H2S去除率约为67%。接下来,将HRT从15 d缩短至10 d,沼气顶空停留时间由3.1 h缩短至2 h。反应器运行60 d后,H2S去除率从67%提升至70%,H2S体积百分数稳定在0.038%左右。尽管沼气顶空停留时间变短,但H2S去除效果并未下降,反而小幅度上升,原因可能是固定化载体生物量和活性逐渐增加,提高了对H2S的利用能力[18]。
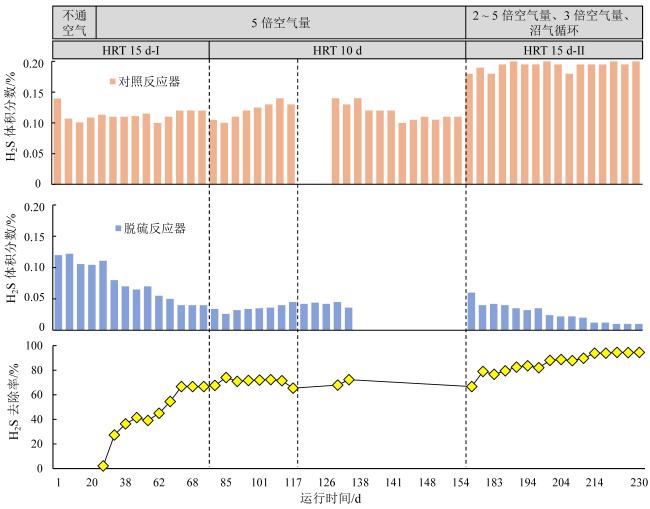
Fig. 1 Comparison of H2S concentration change and removal rate in two groups of reactors图1 两组反应器H2S浓度变化及去除率对比 |
在第176 d,将两组反应器的HRT由10 d延长至15 d,对照反应器沼气中H2S体积百分数升至0.18% ~ 0.2 %。通入过多的空气会引入N2,导致沼气中CH4含量降低,从而降低沼气品质。如图2所示,在第三阶段,考察了空气通入量为2、3、4和5倍时的H2S去除效果,相应的H2S体积百分数为0.06%、0.04%、0.035%和0.032%,H2S去除率分别为67%、78%、81%和82%。本研究中O2的通入量与反应器产沼气量比值范围为0.18% ~ 0.45%。文献报道,以日产沼气体积0.44% ~ 0.62%的O2通入到制糖废水污泥厌氧反应器,在顶空沼气停留时间为2.4 h的条件下,可获得72%的H2S去除效果[19]。本研究中,H2S的去除率更高,主要归因于沼气顶空停留时间更长(2.8 h),且反应器顶空设置了固定化载体。另一项研究表明,在沼气顶空停留时间为7.1 h,通入O2量占日产沼气量0.33% ~ 0.5%的条件下,H2S去除率达到99%[20]。适当延长沼气顶空停留时间有利于原位生物高效去除H2S。在本研究中,通入理论需氧量3倍的空气量能够在较小通气量的条件下实现78%的H2S去除效率,但H2S体积百分数(0.04%)仍然超过《沼气电站技术规范》(NY/T 1704-2009)中发电的要求[21]。
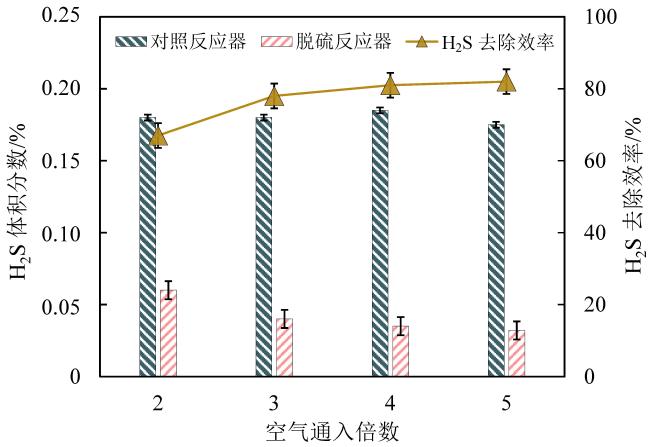
Fig. 2 Comparing the effects of H2S removal at different air injection图2 不同空气通入量对H2S去除效果的对比 |
Table 2 Effects of different air injection and biogas recirculation on the removal of H2S表2 不同空气通入量及沼气循环对H2S去除率的影响 |
| 沼气循环通入 | 空气通入倍数 | 空气通入速度/(mL/h) | (通入空气量/沼气量)/% | H2S体积分数/% | H2S去除率/% |
|---|---|---|---|---|---|
| 无 | / | / | / | 0.180 | / |
| 无 | 2 | 6 | 0.9 | 0.060 | 67 |
| 无 | 3 | 9 | 1.4 | 0.040 | 78 |
| 无 | 4 | 12 | 1.8 | 0.035 | 81 |
| 无 | 5 | 15 | 2.3 | 0.032 | 82 |
| 有 | 3 | 9 | 1.4 | 0.010 | 95 |
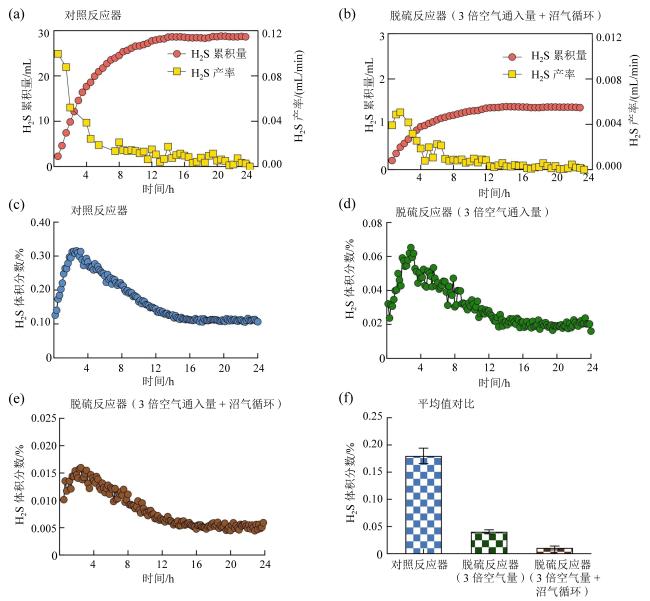
Fig. 3 Variation in H2S accumulation, yield, and concentration under different process conditions during a feeding cycle图3 一个进料周期内不同工艺条件H2S累积量、产率及浓度变化 |
沼气再循环通常注入至反应器的液相部分,用于去除高含氮原料厌氧发酵过程产生的总氨氮[22],缓解厌氧膜生物反应器运行过程中膜污染的发生[23],降低膜片的跨膜压差[24],或提供混合动力,提升厌氧消化产气性能[25]。例如,在鸡粪高温厌氧反应器内进行原位沼气再循环,循环速率为5 L/min,可将氨氮去除率提升至55%[22]。在以餐厨垃圾与污水污泥的厌氧反应器内进行沼气再循环,2 L/min的循环速率和15 min/h的混合时间条件下,相比于机械搅拌,获得了更高的沼气产量,强化了发酵系统的水解性能并促进了有机酸的产生[25]。本研究在反应器顶空循环沼气,在不延长沼气顶空停留时间的情况下,将发酵前期快速产气阶段未来得及参与反应的O2重新回流至反应器顶空,O2被硫氧化细菌捕获,与H2S进行反应,起到了增加混合的作用[26]。
2.2 空气通入量对产甲烷性能的影响
结合表3和图4的信息可知,在实验运行的第一阶段,脱硫反应器的甲烷产率高于对照反应器,而总挥发性脂肪酸(total volatile fatty acids, TVFA)低于对照反应器。对照反应器的平均CH4浓度、CO2浓度及容积产沼气率分别为60%、40%及3.8 L/(L∙d);而脱硫反应器的平均CH4浓度、CO2浓度及容积产沼气率分别为58%、42%及4.2 L/(L∙d),显著性值p < 0.000 1,显示其差异显著。脱硫反应器的甲烷产量高于对照反应器,表明5倍空气通入对餐厨垃圾高温厌氧发酵过程产生积极影响。有研究表明,向鸡粪中温厌氧反应器顶空通入空气可以提高甲烷产量。按照理论需氧量的1、2、3倍,沼气顶空停留时间为12 h时,甲烷产量同比提升了4.3%、5.3%和6.4%[8]。然而,另一项研究显示,在污泥厌氧消化反应中,当沼气顶空停留时间为5.3 h时,提高空气通入量并未显著改善COD去除率、VS降解率和甲烷产率[27]。此外,还有研究表明在不同氧负荷条件下,增加空气通入量对玉米秸秆预处理反应器顶空中的甲烷产量影响有限[28]。因此,不同研究结果的差异可能是由于沼气顶空停留时间的影响所致。应用原位脱硫工艺需选择适当的空气通入倍数,空气量供应不足则无法有效去除H2S,而过量的通入空气会影响沼气品质并且削弱对发酵过程的促进作用。
Table 3 Comparison of fermentation performance between an HRT of 15 d in the control reactor and the desulfurization reactor表3 HRT 15 d对照反应器和脱硫反应器的发酵性能对比 |
| 反应器 | OLR/ [kg/(m3∙d)] | 沼气容积产气率/ [L/(L∙d)] | 甲烷产率/ (mL/g) a | CH4浓度/% | pH | TVFA浓度/ (mg/L) | 沼气顶空停留时间/h |
|---|---|---|---|---|---|---|---|
| 对照反应器 | 7.1 ± 0.7 | 3.8 ± 0.2 | 280 ± 5 | 60 ± 4 | 7.83 ± 0.04 | 510 ± 340 | 3.1 |
| 脱硫反应器 | 7.1 ± 0.7 | 4.2 ± 0.2 | 310 ± 5 | 58 ± 2 | 7.86 ± 0.06 | 530 ± 320 | 2.8 |
注:a表示甲烷产率以COD质量计。 |
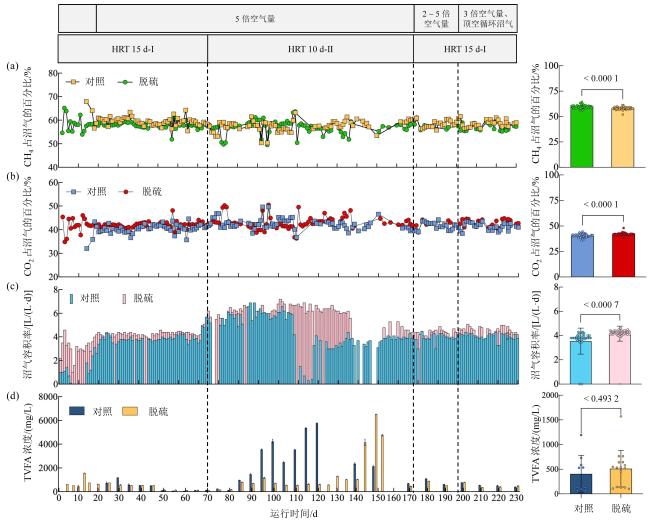
Fig. 4 Comparison of fermentation performance of control and desulfurization reactors图4 对照反应器和脱硫反应器发酵性能对比 |
在HRT 15 d的稳定运行期间,对对照反应器和脱硫反应器在24 h内的产气状况进行跟踪测试。实验持续3 d,根据平均产气数据拟合产沼气一级动力学曲线,结果如图5(a)所示。对照反应器和脱硫反应器的产气动力学常数K分别为0.09和0.10 d-1,表明脱硫反应器的产气速率更快。有研究发现,向顶空通入微量空气可以加快产气速率,从动力学角度分析,脱硫反应器的产甲烷动力学常数K1(0.098 d-1)高于对照组反应器(K2 = 0.088 d-1)[8],与本研究结果一致。图5(b)对比了HRT 15 d(第一阶段)两组反应器的连续产气效果(产气率以VS质量计),脱硫反应器的沼气产率较对照反应器提升了9.9%,甲烷产率提升了8.5%。本实验中得到的甲烷产率提升结果与文献报道的结果相近[8,29]。
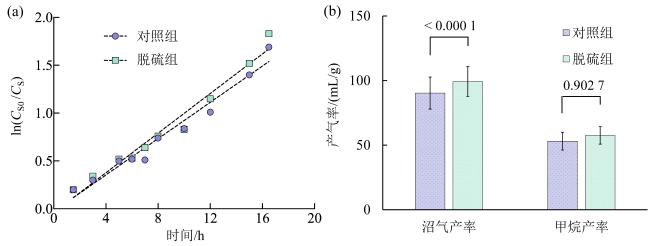
Fig. 5 Comparison of gas production from control and desulfurization reactors under HRT 15 d conditions: (a) first stage kinetic fitting for reactor methane production; (b) comparison of gas production rates图5 HRT 15 d条件下对照反应器和脱硫反应器产气对比:(a)反应器产甲烷一级动力学拟合;(b)产气率对比 |
2.3 通入空气量对有机酸高温分解的影响
在HRT15 d的条件下,两组反应器的有机酸浓度无显著差异。在第一阶段后期,对照反应器和脱硫反应器液相有机酸浓度均处于较低水平,分别为97 mg/L和122 mg/L,没有显著差异(p = 0.493 2)。两组反应器内的pH均保持在7.8左右,较低的VFA浓度和弱碱环境表明系统运行稳定。研究显示,向顶空通入空气可以降低脱硫组反应器的有机酸浓度,尤其在沼气容积率低的情况下效果更为显著[8,9]。为了探究通入空气量对有机酸的降解和转化的影响,对比了HRT 15 d(第一阶段)稳定运行期内,两组反应器中乙酸和丙酸浓度在一个进料周期随时间的变化情况,并对结果进行拟合,实验持续3 d。在进料周期前4 h,对照反应器中乙酸浓度从830 mg/L上升至1 400 mg/L,脱硫反应器中乙酸浓度从1 210 mg/L上升至1 930 mg/L。对照反应器中丙酸浓度从290 mg/L上升至650 mg/L,脱硫反应器中丙酸浓度从220 mg/L上升至550 mg/L。图6展示了两组反应器在进料后4 ~ 24 h时乙酸和丙酸的降解拟合曲线。在乙酸降解阶段,乙酸含量呈指数趋势下降,对照反应器和脱硫反应器的拟合公式分别为:
$ C_{\mathrm{AA}}=-47.46+3825.46 \times \exp (-0.1594 t)$ (4)
$ C_{\mathrm{AA}}=-64.06+3090.06 \times \exp (-0.157 t)$ (5)
式中:CAA为乙酸浓度;t为反应时间。
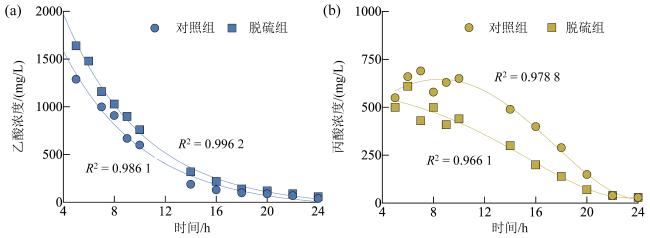
Fig. 6 Degradation pattern of acetic acid and propionic acid in two groups of reactors at HRT for 15 d图6 两组反应器在HRT 15 d条件下的乙酸和丙酸降解规律 |
在丙酸降解阶段,对照反应器和脱硫反应器的拟合公式分别为:
$ C_{\mathrm{PA}}=0.0219 t^{4}-1.0552 t^{3}+14.583 t^{2}-74.491 t+749.06$ (6)
$ C_{\mathrm{PA}}=0.0055 t^{4}-0.192 t^{3}+1.1529 t^{2}-16.605 t+609.58$ (7)
式中:CPA为丙酸浓度。
拟合参数如表4所示。脱硫反应器中乙酸和丙酸的降解速率均高于对照反应器,更快的丙酸降解速率使脱硫反应器向着更加稳定的状态运行。
Table 4 Two groups of reactors acetic acid and propionic acid degradation curve fitting parameters at HRT 15 d表4 HRT 15 d两组反应器乙酸和丙酸降解曲线拟合参数 |
| 组别 | 乙酸降解 | 丙酸降解(x0 = 15) | ||
|---|---|---|---|---|
| k | b | k | b | |
| 对照组 | -0.159 4 | 3 090.06 | -129.844 | 1 919.264 |
| 脱硫组 | -0.157 0 | 3 825.46 | 10.012 | 1 206.758 |
注:k为拟合函数的斜率,b为拟合函数的截距,x0 = 15表示拟合函数在运行时间为15 h时取点计算。 |
3 结论
餐厨垃圾高温厌氧消化的沼气容积产气率高,沼气顶空停留时间较短,进行反应器内生物脱硫时H2S去除难度大。通过优化空气通入量和顶空循环沼气的工艺条件,测试了向反应器顶空通入2 ~ 5倍空气量的H2S去除效果,并验证了顶空循环沼气的可行性。实验结果显示,在一个进料周期内,向反应器顶空通入3倍空气量并将日产沼气在反应器顶空进行一次循环,H2S体积分数从0.2%降至0.01%,H2S去除率达到95%,脱硫后的沼气满足发电要求。空气的通入使甲烷产率提高了8.5%,同时使有机酸浓度低于850 mg/L。反应器内生物脱硫工艺方法在高效去除H2S的同时提高了餐厨垃圾高温厌氧发酵产甲烷性能,具有工程应用前景。
