0 引言
1 合金储氢反应的数值模型
1.1 模型假设
1.2 反应区的守恒方程

 为储氢合金孔隙率;
  为氢气速度矢量;Sm为质量源项,其物理意义为单位时间单位体积由气态氢转化为固态金属氢化物所存储的质量。式(1)反映出氢气的质量变化,即氢气的流动与孔隙区域的吸氢反应量。合金项的质量守恒表达式为:

 为反应平衡时氢原子与金属原子的原子数量比,代表吸氢反应的吸氢量。其中,吸氢反应平衡压强Pe可表示为:
 为插值多项式,其系数为:a0 = -0.348 6,a1 = 10.105 9,a2 = -14.244 2,a3 = 10.353 5,a4 = -4.206 5,a5 = 0.962 4,a6 = -0.115 5,a7 = 0.005 6。
 为切应力;Fv为黏性阻力,是由于多孔介质的存在而产生的,代表氢气在多孔储氢合金中流动的动量损失。
 为反应区域的总热容;Keff为有效导热系数;Q为吸氢反应过程中释放的热量。仿真模型主要参数见表1。
| 参数 | 数值 |
|---|---|
| 初始温度T0/K | 293.15 |
| 参考温度Tref/K | 303.15 |
| 吸氢压强Pin/MPa | 1.5 |
| 参考压强Pref/MPa | 1.5 |
| 吸氢速率常数Ca/s | 59.187 |
| 活化能Ea/(J/mol) | 21 179.6 |
氢气热容  /[J/(mol∙K)] /[J/(mol∙K)] | 1 489 |
储氢合金热容  /[J/(mol∙K)] /[J/(mol∙K)] | 419 |
| 氢气导热系数Kg/[W/(m∙K)] | 0.167 |
| 合金导热系数Ks/[W/(m∙K)] | 1.3 |
| 储氢合金孔隙率ε | 0.65 |
| 孔隙区渗透率k/m2 | 1 × 10⁻⁸ |
| 冷却温度Ts/K | 293.15 |
合金密度  /(kg/m3) /(kg/m3) | 8 300 |
饱和合金密度  /(kg/m3) /(kg/m3) | 8 428 |
1.3 模型验证
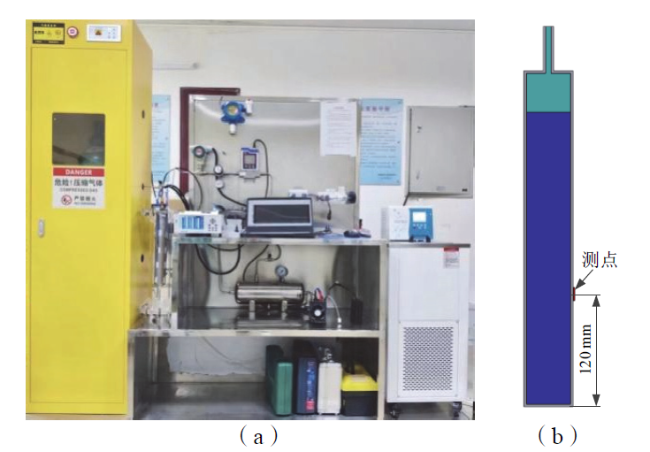
Fig. 1 Schematic structure of the validation model: (a) test platform for hydrogen absorption/release performance of solid metal hydrogen storage system; (b) simulation verification model图1 验证模型结构示意图:(a)固态金属储氢系统吸/放氢性能测试平台;(b)仿真验证模型 |
Table 2 Main parameters of solid metal hydrogen storage tanks表2 固态金属储氢罐主要参数 |
| 参数 | 数值(材质) |
|---|---|
| 罐体材料 | 不锈钢 |
| 罐体尺寸/mm | ϕ56 × L380 |
| 罐体壁厚/mm | 3 |
| 导热系数/[W/(m∙K)] | 14.6 |
| 热通量/(W/m2) | 1 671.02 |
| 储氢材料 | LaNi5 |
| 储氢材料含量/kg | 5 |
| 额定储氢量/L | 560 |
| 接口尺寸/mm | 6 |
| 充氢压力/MPa | 1.5~2.5 |
| 放氢出口压力/MPa | 0.2~1.0 |
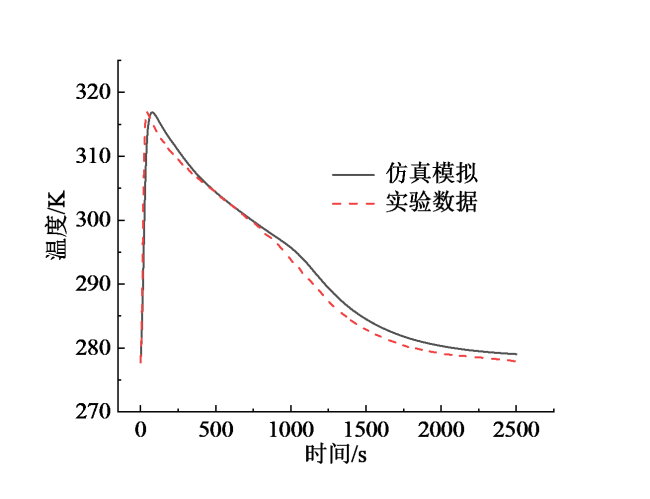
Fig. 2 Comparative analysis of simulation results and experimental results图2 仿真模拟结果与实验结果对比分析 |
2 罐式反应器仿真模拟结果与讨论
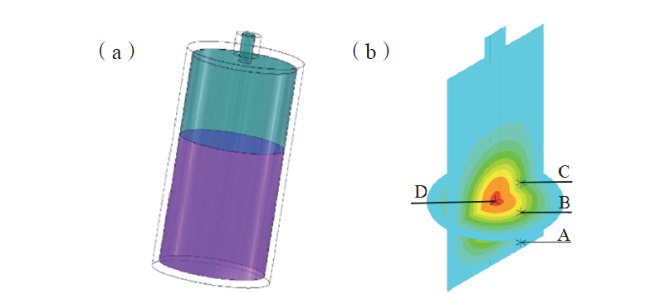
Fig. 3 Tank reactor: (a) reactor model; (b) temperature measurement point selection图3 罐式反应器:(a)反应器模型;(b)测温点选取 |
Table 3 Main parameters of tank reactor simulation表3 罐式反应器仿真主要参数 |
| 参数 | 数值(材质) |
|---|---|
| 罐体尺寸/mm | ϕ56 × L116 |
| 罐体壁厚/mm | 3 |
| 储氢材料 | LaNi5 |
| 储氢材料含量/kg | 1 |
| 吸氢压强/MPa | 1.5 |
| 初始温度/K | 293.15 |
Fig. 4 Simulation results of tank reactor图4 罐式反应器仿真结果 |
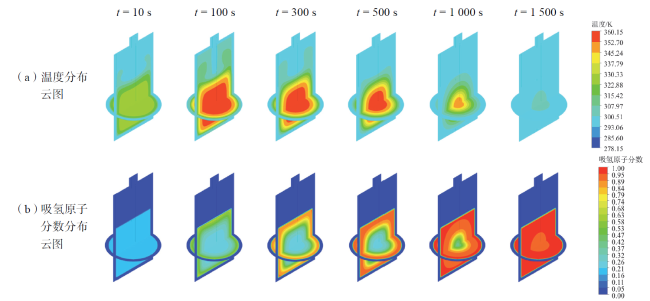
Fig. 5 Simulation of hydrogen adsorption reaction in tank reactors图5 罐式反应器吸氢反应仿真模拟云图 |
3 系统传热结构优化与仿真模拟
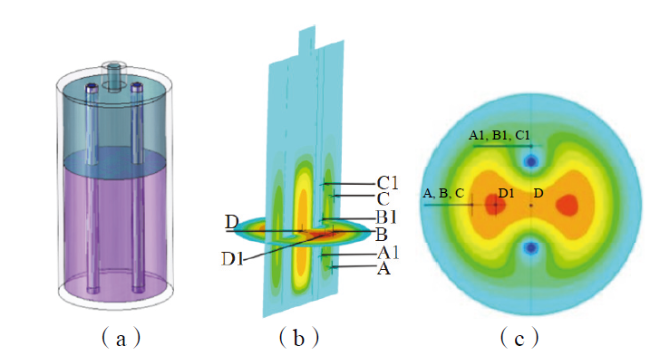
Fig. 6 Double cooling tube reactor: (a) reactor model;(b) temperature measurement point selection; (c) temperature measurement point location图6 双冷却管反应器:(a)反应器模型;(b)测温点选择;(c)测温点位置 |
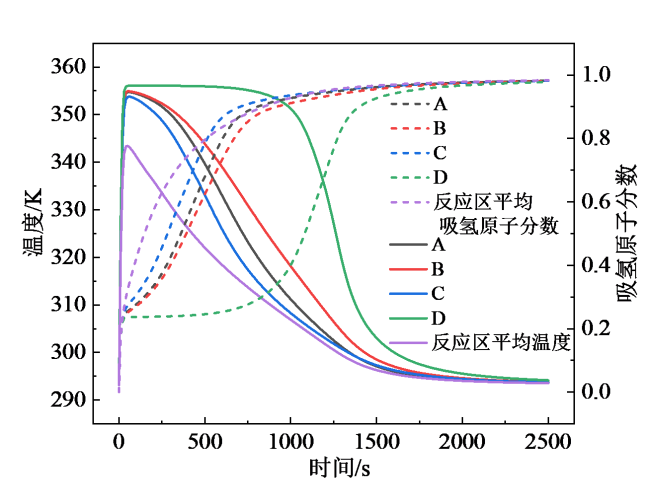
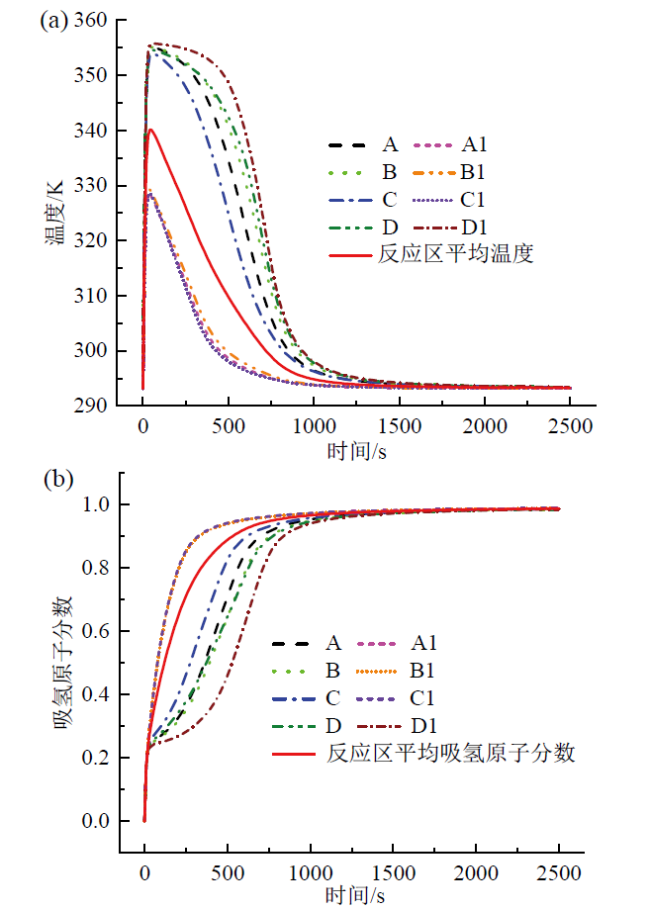
Fig. 7 Simulation results of double cooling tube reactor:(a) temperature curves; (b) atomic fraction curves图7 双冷却管反应器仿真结果:(a)温度曲线;(b)原子分数曲线 |
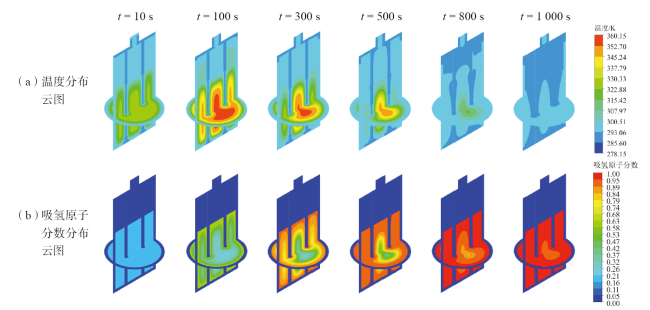
Fig. 8 Simulation of hydrogen adsorption reaction in a double cooling tube reactor图8 双冷却管反应器吸氢反应仿真模拟云图 |
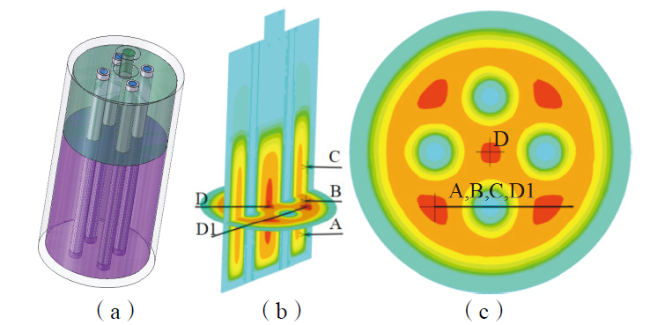
Fig. 9 Four cooling tube reactor: (a) reactor model; (b) temperature measurement point selection; (c) temperature measurement point location图9 四冷却管反应器:(a)反应器模型;(b)测温点选择;(c)测温点位置 |
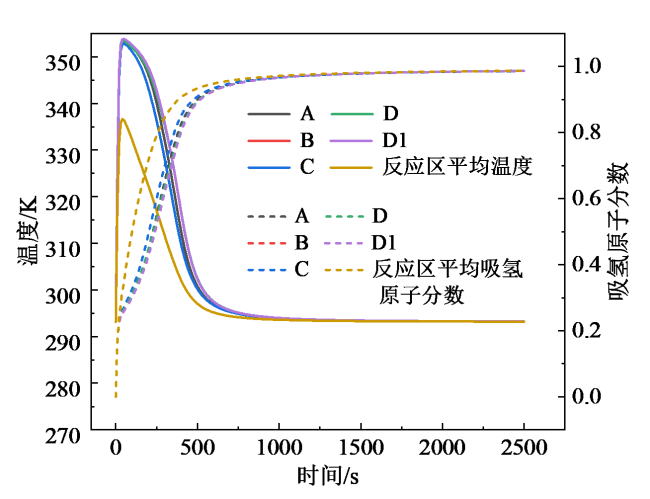
Fig. 10 Simulation results of four cooling tube reactor图10 四冷却管反应器仿真结果 |
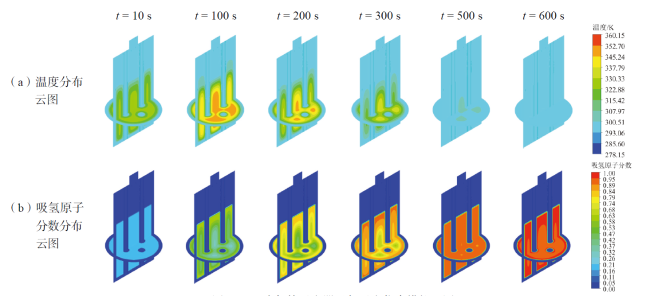
Fig. 11 Simulation of hydrogen absorption reaction in a four cooling tube reactor图11 四冷却管反应器吸氢反应仿真模拟云图 |
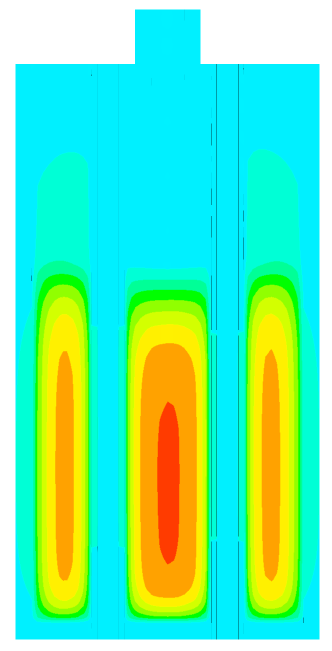
Fig. 12 Axial section of a four cooling tube reactor图12 四冷却管反应器轴向切面 |
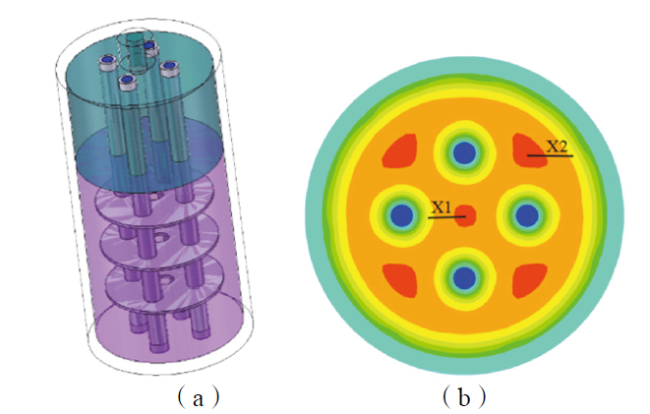
Fig. 13 Schematic diagram of the structure of optimized scenario A: (a) reactor model; (b) temperature measurement point selection图13 优化方案A结构示意图:(a)反应器模型;(b)测温点选取 |
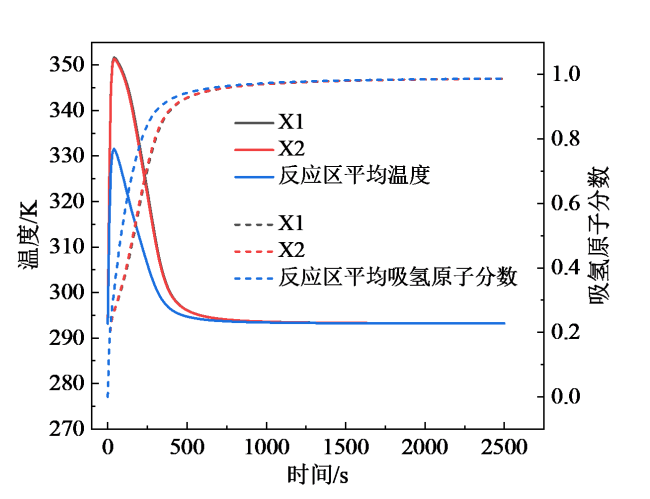
Fig. 14 Simulation results of optimized scenario A图14 优化方案A仿真结果 |
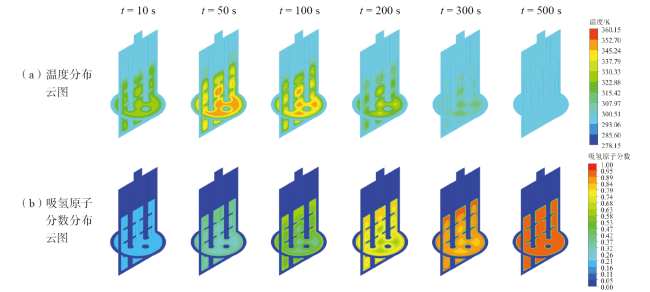
Fig. 15 Simulation cloud diagram of optimized scenario A图15 优化方案A仿真模拟云图 |
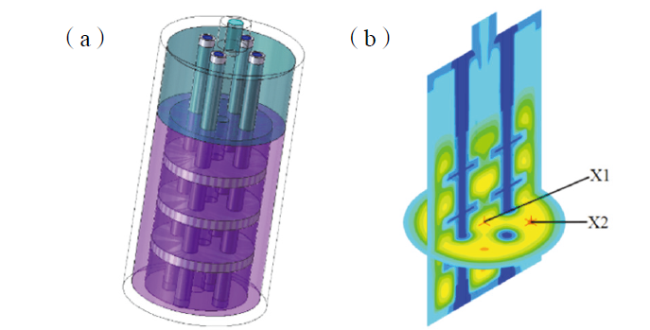
Fig. 16 Structure of optimized scenario B: (a) reactor model; (b) temperature measurement point selection图16 优化方案B结构:(a)反应器模型;(b)测温点选取 |
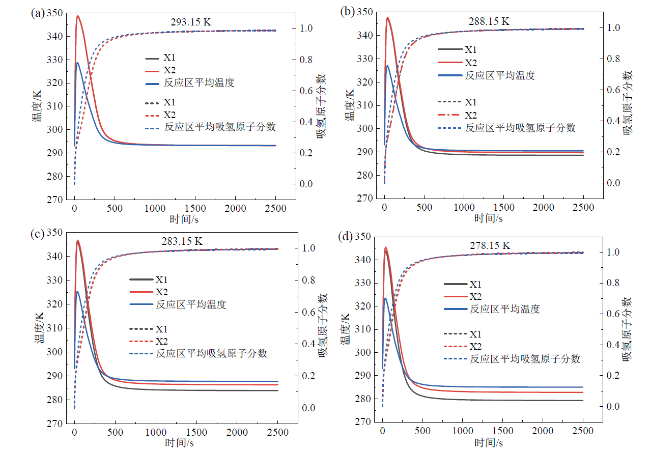
Fig. 17 Temperature and atomic fraction curves of the hydrogen absorption reaction at different cooling temperatures of optimization scenario B图17 优化方案B在不同冷却温度下的吸氢反应温度曲线和原子分数曲线 |
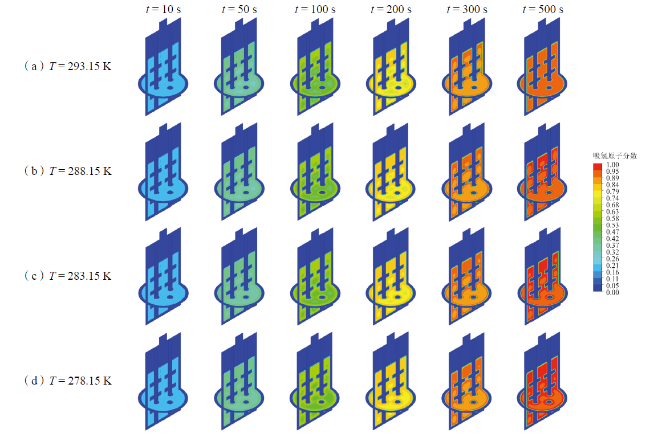
Fig. 19 Simulation hydrogen-absorbing atom fraction cloud diagram of optimized scenario B图19 优化方案B仿真模拟吸氢原子分数分布云图 |
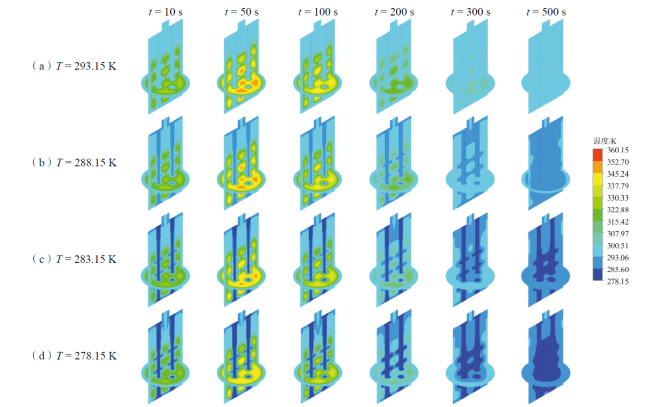
Fig. 18 Simulation temperature distribution cloud diagram of optimized scenario B图18 优化方案B仿真模拟温度分布云图 |
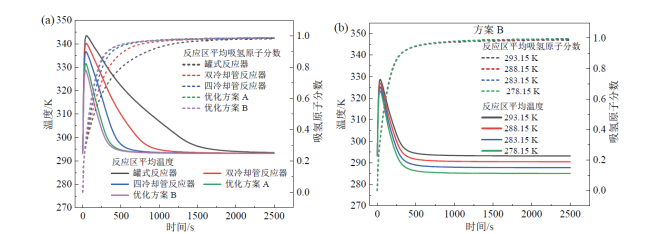
Fig. 20 Curves of average reaction zone temperature and average hydrogen-absorbing atom fraction in the reaction zone for each scheme at 293.15 K (a) and scenario B at different cooling temperatures (b)图20 各方案在293.15 K下(a)及方案B在不同冷却温度下(b)的反应区平均温度及反应区平均吸氢原子分数曲线 |
Table 4 Statistical data for different scenarios表4 各方案数据统计 |
| 方案名称(冷却条件) | 方案代号 | 温降时长/s | 吸氢时长/s |
|---|---|---|---|
| 罐式反应器 | 0 | 2 030 | 1 200 |
| 双冷却管反应器 | 1 | 1 200 | 790 |
| 四冷却管反应器 | 2 | 800 | 620 |
| 优化方案A | A | 630 | 560 |
| 优化方案B(293.15 K) | B293 | 580 | 550 |
| 优化方案B(288.15 K) | B288 | 350 | 530 |
| 优化方案B(283.15 K) | B283 | 290 | 520 |
| 优化方案B(278.15 K) | B278 | 250 | 520 |
Fig. 21 Temperature drop duration and hydrogen absorption duration for each scenario图21 各方案温降时长与吸氢时长对比 |


