

0 引言
随着绿色低碳发展推进,国务院提出大力发展新能源汽车产业,促进新经济健康发展。虽然锂离子电池发展迅速、应用广泛,但若发生安全问题,后果十分严重。新能源汽车在充电过程中易因电池内部热失控造成爆炸起火事故,相较传统燃油汽车,新能源汽车电池部件更易受损,因此明确其安全工作条件尤为重要。动力电池作为新能源汽车的关键部件,其安全运行是人们关注的重点,因热失控引起的动力电池火灾、爆炸等安全事故成为新的风险因素。
自WANG等[1]利用实验证明锂离子电池的安全问题主要与其热失控相关,诸多学者从单体电池的火灾危险性及其火灾蔓延过程展开分析研究。陈吉清等[2]研究在过充、过热、内短路等极端情况下动力电池温度和电压变化情况。杜光超等[3]总结不同荷电状态(state of charge, SOC)下锂离子电池热失控参数变化规律。目前利用仿真软件实验已成为深入研究锂离子电池理化性质的重要手段之一[4,5]。尤其是对其热失控过程的模拟,不仅可以得到实验难以重复或表征的内部现象,而且便于揭示电池产热产气机理,分析影响热失控的主要因素,达到预测电池热行为的目的[6,7]。刘得星[8]利用火灾动力学模拟(fire dynamics simulator, FDS)软件构建锂离子电池火灾模型,模拟其火灾发生及灭火过程。YAMAUCHI等[9]针对锂电池建立模型,计算电池在充放电时内部短路时的温度变化。WU等[10]利用均匀内热源模型,模拟电池在不同换热条件下电池发热情况。严刚等[11]和李顶根等[12]采用分环测温法分析了整体电池模型热失控的分布特征。
现有研究往往集中于火灾发展过程,构建模型较为简单,极少考虑电池实际分层情况,且并没有从本质安全化的角度进行预防。本文基于前人的研究结果,明确热失控发展机理,利用COMSOL模拟软件构建锂离子电池单体模型,进一步探究锂离子电池热失控发生过程及其影响因素,结合分析结果进行装置设计,为新能源汽车热安全事故预防提供参考。
1 热失控机理
1.1 热失控发展过程
锂离子电池热失控大致可分为三阶段,即加热阶段、喷射和燃烧阶段、熄灭阶段[13]。加热阶段过程中,随着辐射加热时间的增加,锂离子电池的表面温度升高,电池内部的化学反应积累了大量气体和热量。由于锂离子外壳为钢壳,几乎不会发生膨胀等体积变化。当电池内部压力达到安全阀耐压极限时发生破裂,释放可燃性气体等使得电池由“封闭系统”变为“开放系统”,加速金属锂、电解液等副反应,进而加速温度上升。
喷射和燃烧阶段过程中,随着电池副反应的进行,电池温度持续上升,积累的能量和气体增多,达到喷射压力时,电解液分解的大量气溶胶雾滴将会被喷射出并形成白色烟雾。并且SOC越大会使得电池内部化学反应越剧烈,内部的非易燃性物质将随气溶胶雾滴一起喷出形成白色火花。这类白色烟雾能够在释放瞬间被点燃,发生燃烧爆炸等安全事故。
熄灭阶段过程中,随着电池燃烧的进行,可燃性气体不断被消耗,燃烧火焰将逐渐减弱至最终熄灭。具体锂离子电池热失控发展过程详见图1所示。
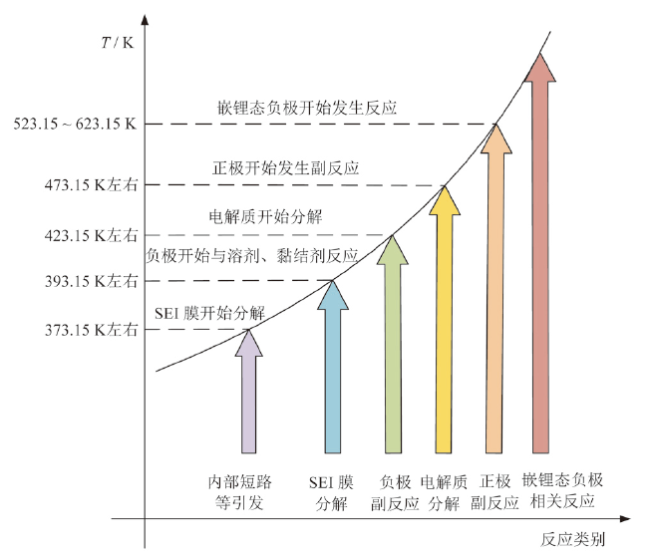
Fig. 1 The development of thermal runaway of lithium-ion batteries图1 锂离子电池热失控发展示意图 |
1.2 热失控产热机理
在锂离子电池发生热失控时,因副反应产生大量热,内部材料快速分解,各部分反应加剧,进而导致电池温度持续上升。其中副反应主要包括四部分内容,具体如下。
(1)固体电解质界面膜分解反应
${{R}_{\text{sei}}}\left( T\text{,}{{C}_{\text{sei}}} \right)\text{=}{{A}_{\text{sei}}}\text{exp}\left( -\frac{{{E}_{\text{a,sei}}}}{RT} \right){{C}_{\text{sei}}}$ (1)
${{Q}_{\text{sei}}}\text{=}{{H}_{\text{sei}}}{{W}_{\text{sei}}}{{R}_{\text{sei}}}$ (2)
$\frac{\text{d}{{C}_{\text{sei}}}}{\text{d}t}\text{=}-{{R}_{\text{sei}}}$ (3)
式中:Csei为亚稳态下固体电解质界面(solid electrolyte interphase, SEI)膜的无量纲量;Rsei为SEI膜分解的反应参数;Asei为SEI膜分解反应的频率因子;Ea,sei为SEI膜分解反应的反应活化能;Hsei为SEI膜的分解生热率;Wsei为SEI膜分解反应的单位体积碳含量。
(2)负极与电解液反应
${{R}_{\text{neg}}}\left( T\text{,}{{C}_{\text{neg}}} \right)\text{=}{{A}_{\text{neg}}}\text{exp}\left( -\frac{{{E}_{\text{a,neg}}}}{RT} \right){{C}_{\text{neg}}}$ (4)
${{Q}_{\text{neg}}}\text{=}{{H}_{\text{neg}}}{{W}_{\text{neg}}}{{R}_{\text{neg}}}$ (5)
$\frac{\text{d}{{C}_{\text{neg}}}}{\text{d}t}\text{=}-{{R}_{\text{neg}}}$ (6)
式中:Cneg为负极碳层锂离子含量的无量纲量;Rneg为负极与电解液反应的反应参数;Aneg为负极与电解液反应的频率因子;Ea,neg为负极与电解液反应的反应活化能;Hneg为负极与电解液反应的反应生热率;Wneg为负极与电解液反应的单位体积碳含量。
(3)正极与电解液反应
${{R}_{\text{pos}}}\left( T\text{,}a \right)\text{=}{{A}_{\text{pos}}}a\left( \text{1}-a \right)\text{exp}\left( -\frac{{{E}_{\text{a,pos}}}}{RT} \right)$ (7)
${{Q}_{\text{pos}}}\text{=}{{H}_{\text{pos}}}{{W}_{\text{pos}}}{{R}_{\text{pos}}}$ (8)
$\frac{\text{d}a}{\text{d}t}\text{=}-{{R}_{\text{pos}}}$ (9)
式中:α为正极材料中参与反应的转化率;Rpos为正极与电解液反应的反应参数;Apos为正极与电解液反应的频率因子;Ea,pos为正极与电解液反应的反应活化能;Hpos为正极与电解液反应的反应生热率;Wpos为正极与电解液反应的单位体积正极活性材料含量。
(4)电解质分解反应
${{R}_{\text{ele}}}\left( T\text{,}{{C}_{\text{ele}}} \right)\text{=}{{A}_{\text{ele}}}\text{exp}\left( -\frac{{{E}_{\text{a,ele}}}}{RT} \right){{C}_{\text{ele}}}$ (10)
${{Q}_{\text{ele}}}\text{=}{{H}_{\text{ele}}}{{W}_{\text{ele}}}{{R}_{\text{ele}}}$ (11)
$\frac{\text{d}{{C}_{\text{ele}}}}{\text{d}t}\text{=}-{{R}_{\text{ele}}}$ (12)
式中:Cele为电解液中电解质浓度的无量纲量;Rele为电解质分解反应的反应参数;Aele为电解质分解反应的频率因子;Ea,ele为电解质分解反应的反应活化能;Hele为电解质分解反应的反应生热率;Wele为电解质分解反应的单位体积电解质含量。
2 模型构建
2.1 几何模型构建
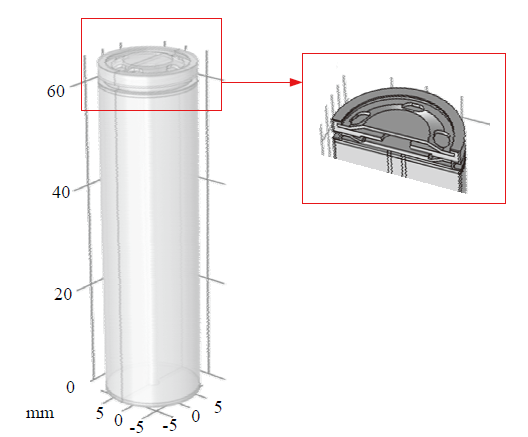
Fig. 2 Geometric model of lithium-ion batteries图2 锂离子电池几何模型 |
Table 1 Electrochemical reaction parameter values表1 电化学反应参数值 |
| 电池结构 | 扭曲布鲁格曼系数 | 初始电解质盐浓度 / (mol/m3) | 电解质相体积分数 | 固相体积分数 | 厚度 / μm | 粒子半径 / μm | 交换电流密度 / (A/m2) |
|---|---|---|---|---|---|---|---|
| 正极 | 2.98 | / | 0.517 | 0.46 | 71.5 | 2.5 | 17.44 |
| 正极集流体 | / | / | / | / | 15.0 | / | / |
| 交换膜 | 3.15 | 1 200 | 0.560 | / | 16.0 | / | / |
| 负极集流体 | / | / | / | / | 10.0 | / | / |
| 负极 | 2.50 | / | 0.590 | 0.41 | 75.0 | 2.5 | 0.96 |
Table 2 Material thermophysical property parameter values表2 材料热物性参数值 |
| 电池结构 | 密度 / (kg/m3) | 比热容 / [J/(kg∙K)] | 导热系数 / [W/(m∙K)] |
|---|---|---|---|
| 正极 | 2 791.0 | 398.57 | 0.7628 |
| 正极集流体 | 2 700.0 | 903.00 | 238.0000 |
| 交换膜 | 1 122.4 | 885.46 | 0.4020 |
| 负极集流体 | 8 900.0 | 385.00 | 398.0000 |
| 负极 | 1 647.7 | 668.17 | 0.6919 |
2.2 热失控模型构建
结合上述热失控机理分析,构建热失控模型,依据锂离子电池实际状况,设置副反应参数值,详见表3所示。
Table 3 Side reaction parameter values表3 副反应参数值 |
| 参数 | 数值 | 单位 |
|---|---|---|
| Hsei | 2.570×10⁵ | J/kg |
| Hneg | 1.714×10⁵ | J/kg |
| Hpos | 1.947×10⁵ | J/kg |
| Hele | 6.200×10⁵ | J/kg |
| Ea,sei | 1.38×10⁵ | J/mol |
| Ea,neg | 1.32×10⁵ | J/mol |
| Ea,pos | 9.90×10⁴ | J/mol |
| Ea,ele | 2.70×10⁵ | J/mol |
| Wsei | 1.947×10⁵ | kg∙m3 |
| Wneg | 220.000 | kg∙m3 |
| Wpos | 520.000 | kg∙m3 |
| Wele | 334.000 | kg∙m3 |
| α0 | 0.04 | 1 |
| Asei | 1.66×10¹⁵ | s-1 |
| Aneg | 2.50×10¹³ | s-1 |
| Apos | 2.00×10³ | s-1 |
| Aele | 5.14×1025 | s-1 |
| msei | 1 | 1 |
| mneg | 1 | 1 |
| mpos | 1 | 1 |
| mele | 1 | 1 |
| Csei0 | 0.15 | 1 |
| Cneg0 | 0.75 | 1 |
| Cele0 | 1 | 1 |
| tsei0 | 0.033 | 1 |
3 仿真实验分析
3.1 电化学性能分析
对单体模型进行电化学性能模拟,仿真结果与实验结果高度一致。1 C充放电循环中端电压和电流随时间的变化情况如图3所示。在恒流充电过程中,电池的端电压最高上升到4.06 V,在充电初期电压上升速率较快,此时正负极活性材料的平衡电位主要受SOC变化影响。在恒压充电过程中,电池电量依旧会逐渐上升。随后搁置过程中,电池端电压会有所下降,由于电池内部存在的锂浓度梯度会随搁置发生扩散,缓解了电池内部极化。在恒流放电过程中,电池的端电压下降到3.51 V。随后搁置过程中,端电压会有所上升。
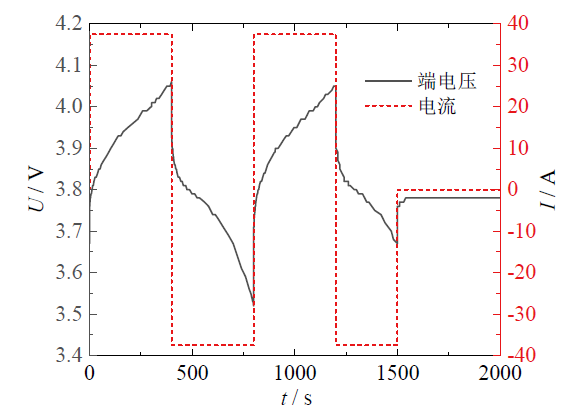
Fig. 3 Battery end voltage and current change curve in the 1 C charge and discharge cycle图3 1 C充放电循环中电池端电压和电流变化曲线 |
1 C充放电循环中电池温度变化情况如图4所示,图中温度表示为电池内部电芯截面平均、最高、最低温度。在恒流充电过程中,由于电池内部产热远高于表面散热,电池温度逐渐升高。恒压充电过程中,电池持续充入电量,但各测点温度有所下降,因为此时充入电量较少,内部产热低于表面散热。恒流放电过程中,电池温度迅速升高。随后搁置过程中,电池温度持续下降。
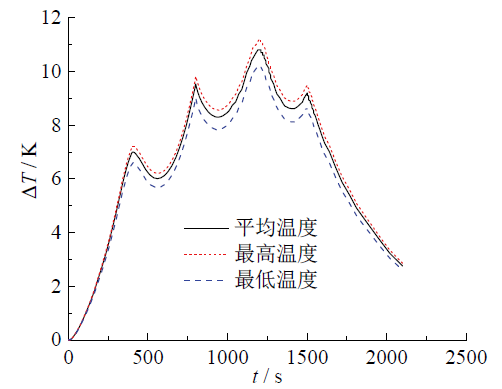
Fig. 4 Battery temperature change curve in the 1 C charge and discharge cycle图4 1 C充放电循环中电池温度变化曲线 |
3.2 热性能分析
对单体模型进行热性能模拟,仿真结果与实验结果高度一致。在不同充电时刻,单体模型截面温度分布如图5所示。充电期间最高温度出现在正负极表面,充电末期最高温度出现在电芯中心区域。随着充电过程进行,电池温度缓慢上升,且电池内部温度始终高于表面温度。
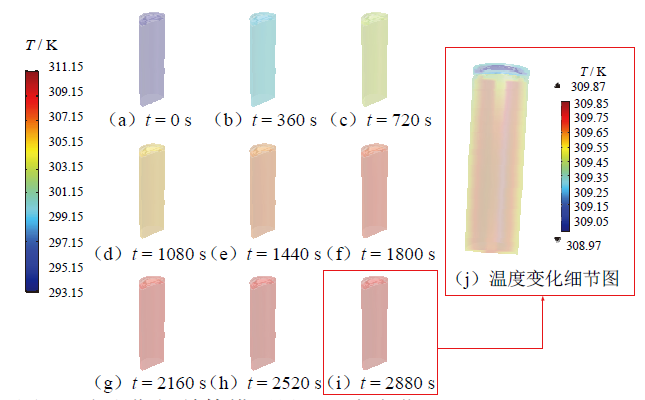
Fig. 5 Temperature change of the 3 D model interface during charging图5 充电期间单体模型界面温度变化 |
在293.15 K环境下,电池单体最高温度约为309.84 K,充电末期电池最大温差约为0.89 K(在5 K以内),可认为在当前充电倍率与换热条件下电池具有较好的温度一致性。为保持良好的充放电性能,锂电池最佳工作温度范围为293.15 K ~ 313.15 K[14]。充电末期,电芯内部温度明显高于表面温度,尤其是中心区域温度最高,因为此时表面对流换热,热量能够及时与外界环境进行交换,而内部热传递换热,热量无法及时散出。
3.3 热失控影响因素分析
3.3.1 环境温度影响分析
设定域微分方程,保持电池初始温度273.15 K不变,在恒定热对流系数h = 5 W/(m2·K)[15]条件下进行加热实验。将电池分别置于低温、高温环境下进行加热,其中低温为213.15 K、233.15 K、253.15 K、273.15 K,高温为333.15 K、393.15 K、413.15 K、453.15 K、473.15 K、513.15 K。当电池在环境温度为453.15 K、473.15 K、513.15 K下会发生热失控,分别在2 060 s、1 660 s、1 170 s左右达到713.15 K后,锂离子电池内部发生剧烈副反应,释放大量热导致电池温度瞬间升高。当电池处于其他环境温度下,几乎均在5 000 s左右趋于稳定状态。具体温度变化如图6所示。
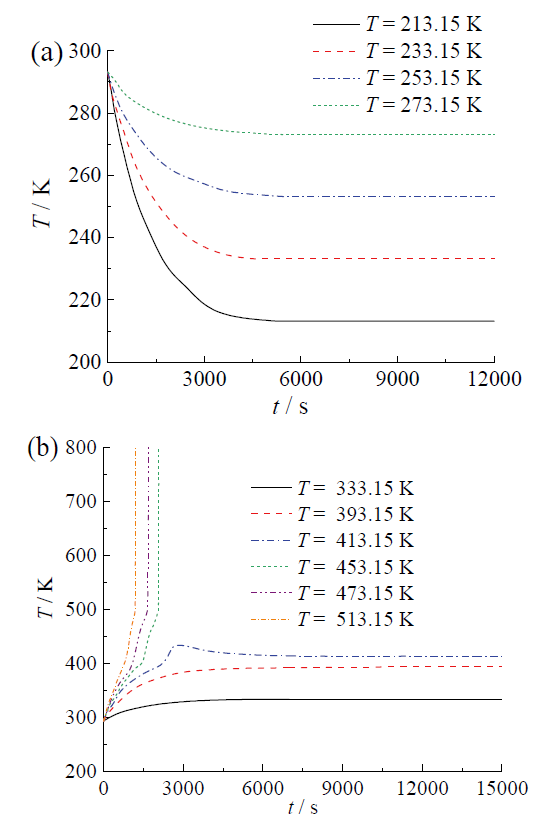
Fig. 6 Battery temperature change curve in a low-temperature (a) and high-temperature (b) heating environment图6 低温(a)和高温(b)加热环境下的电池温度变化曲线 |
部分高温环境下电池内部各组分成分变化如图7所示。当锂离子电池达到一定温度时,内部副反应依次发生,其中SEI膜分解反应最先发生,产生大量热促使电池温度进一步上升,达到一定温度时负极活性材料与电解液发生反应。若此时副反应所释放的热未达到正极活性材料与电解液反应的温度临界点,电池温度会出现先上升后下降的趋势,在SEI膜与负极活性材料反应结束后,温度逐渐趋于稳定。图7a所示为413.15 K环境温度下电池温度变化。若此时副反应所释放的热达到正极活性材料与电解液反应的温度临界点,则副反应继续进行,此时释放的热量数值高于其他副反应至少1个数量级,温度迅速上升,电解液与黏结剂发生分解,当电池温度达到773.15 K时,电池温度将处于不可控状态。
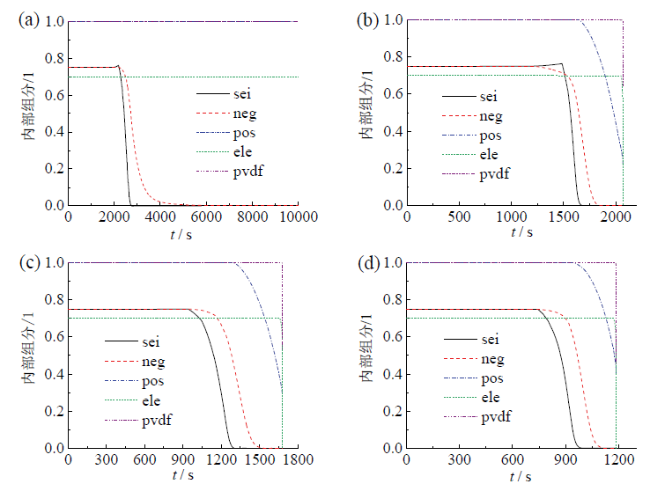
Fig. 7 Change curve of internal components in high temperature environment: (a) ambient temperature of 413.15 K; (b) ambient temperature of 453.15 K; (c) ambient temperature of 473.15 K; (d) ambient temperature of 513.15 K图7 高温环境下电池内部组分变化曲线:(a)环境温度为413.15 K;(b)环境温度为453.15 K;(c)环境温度为473.15 K;(d)环境温度为513.15 K |
通过分析可知,锂离子电池热失控的热量主要来源于电池材料间副反应的发生,正极活性材料与电解液的反应是否发生将是导致热失控的重要节点,因此选取有效正极材料避免其与电解液发生副反应,将可大大减少电池热安全事故的发生。
对比不同温度发现,当环境温度越高,副反应越剧烈,产生热量速率越快,发生热失控时间越早。通过进一步模拟实验发现,热失控临界环境温度为445.08 K,当电池内部最高温度达到临界温度时,导致热失控的副反应将无法自动终止。因此应尽量避免锂离子电池在高温环境下长时间工作,同时应设计并采取有效的热管理措施。
3.3.2 传热系数影响分析
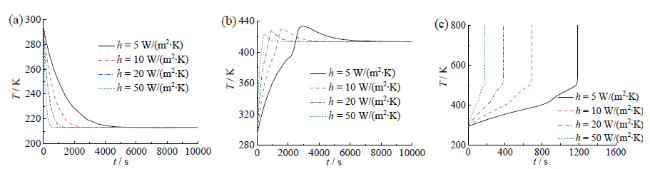
Fig. 8 Battery temperature change curve under different heat transfer coefficients: (a) ambient temperature of 213.15 K; (b) ambient temperature of 413.15 K; (c) ambient temperature of 513.15 K图8 不同传热系数下电池温度变化曲线:(a)环境温度为213.15 K;(b)环境温度为413.15 K;(c)环境温度为513.15 K |
若电池一定会发生热失控,则传热系数越大电池热失控发生时间越早,电池温度变化如图8c所示。当h分别为5 W/(m2·K)、10 W/(m2·K)、20 W/(m2·K)、50 W/(m2·K) 时,电池分别在1 180 s、680 s、380 s、180 s左右发生热失控。该模拟实验反映了电池在高温环境下发生热失控的时间先后受对流传热系数大小的影响,因此电池在高温环境下工作要及时采取散热冷却措施,防止热量积累。
3.3.3 电池不同初始温度模拟
通过上述模拟实验可知,在413.15 K环境温度下电池不会发生热失控,但在453.15 K环境温度下电池会发生热失控,并且发现热失控临界温度为445.08 K。为研究电池本身温度是否会影响热失控的发生,模拟了在失控临界温度445.08 K下,电池不同初始温度对整体温度变化的影响。在维持传热系数为5 W/(m2·K)的状态下,分别设定电池初始温度为273.15 K、293.15 K、313.15 K进行模拟实验,电池温度变化如图9所示。当初始温度为273.15 K时,电池不发生热失控,温度先升高后缓慢下降,最终逐渐趋于稳定状态。当初始温度为293.15 K时,电池于2 740 s左右发生热失控,当初始温度为313.15 K时,电池于2 500 s左右发生热失控,可见热失控时间随初始温度的升高而缩短。电池初始温度越高,内部副反应越易受外界温度刺激而改变,因此要及时采取有效措施控制电池温度,防止自身温度过高。
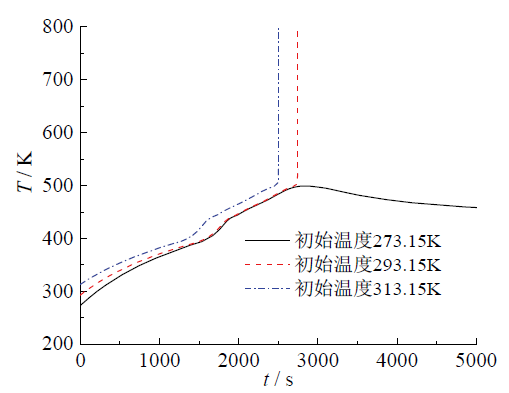
Fig. 9 Battery temperature change curve at different initial temperatures图9 不同初始温度下电池温度变化曲线 |
通过模拟实验可知,锂离子电池在高温环境下工作有发生热失控危险的可能,因此需要采取相应措施加以预防控制。避免电池长时间在高温环境下工作,改进电池自身工艺技术,采用耐性较好的正极活性材料和电解液,采取合理的散热方式,优化电池热管理系统。
4 可延缓热失控装置设计
当动力电池发生热失控时,利用电池热管理系统监控冷却的同时,使用隔热罩延缓其热量扩散。但隔热罩内部空间有限,内部压力会随产热增加而升高,受损速度较快,延缓效果较差。因此针对现有技术不足,结合动力电池热失控过程及影响因素,设计一种能够延缓热失控的汽车电池包。
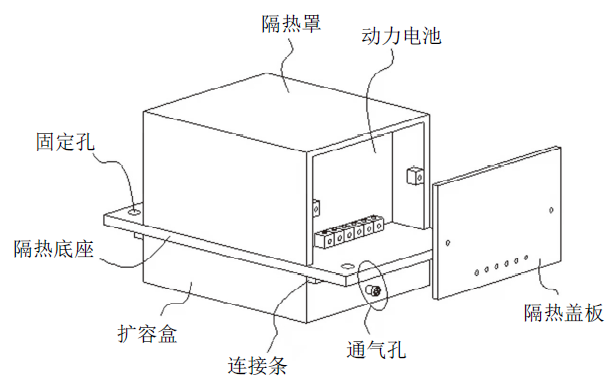
具体设计内容如图10所示。将动力电池安装在隔热罩内部,隔热罩底部连接隔热底座,侧面通过螺丝安装隔热盖板,隔热底座下表面连接扩容盒,扩容盒内滑动安装分隔板,隔板连接处贴合密封套,隔热底座上设置与隔热罩和扩容盒连通的连通孔,远离连通孔一侧的扩容盒设置通气孔。
Fig. 10 Thumbnail plots of devices that can delay thermal runaway图10 可延缓热失控的装置缩略图 |
当动力电池发生热失控时,隔热罩、隔热盖板和隔热底座能够防止动力电池产生的热量传递到其他电池组,实现延缓热失控效果。随着产热增加,隔热罩内部压力增大,隔板在扩容盒内滑动,将原有空气通过通气孔排出,降低内部压力,减缓受损速度,增加延缓时间。同时将扩容盒滑动隔板与行程开关相连,接通新能源汽车的中控台,开启报警系统。
5 结论
(1)明确锂离子电池热失控发展过程及产热机理,通过拆解和基础实验采集基本数据,构建锂离子电池18650单体模型。
(2)分别从环境温度、传热系数、初始温度三方面深入研究分析热失控影响因素。通过系列实验证明,锂离子电池在高温环境下工作有较大可能性发生热失控,热失控临界温度为445.08 K,且传热系数越大热失控时间越早。为避免锂离子电池热失控事故发生,应实时监控电池温度变化情况,当异常温度出现时,需及时采取有效措施加以控制。
(3)锂离子电池热失控的热量主要来源于材料间副反应的发生,正极活性材料与电解液的反应是否发生是导致热失控的重要节点,使用耐高温正极活性材料可有效防止电池热失控发生。
(4)结合模拟结果与实际情况,设计一款可延缓热失控的汽车电池包,弥补现有技术不足,其中核心技术已经中国知识产权局授权。
(5)现有研究在对变量进行考虑过程中,并未结合电池反应放热对温度的影响,后续研究将针对环境温度变化进一步探究。