

0 引言
随着风能产业日趋进步,风力发电所需的成本逐步降低,风能成为“十四五”规划中大力发展的重要能源。2020年9月30日,云南省为了缓解汛枯矛盾,“8 + 3”风光项目规划落地,并出台配套的结构电价政策,即风电项目枯平期(每年11月1日至次年5月31日)2 000 h以内执行燃煤发电上网基准电价,丰水期(每年6月1日至10月31日)500 h以内执行2020年省内集中交易撮合下限价格,枯平期、丰水期超发部分执行竞争性电价(市场化交易电价)。
对于云南风电项目结构电价下的投资决策,风资源评估时需要分别计算枯平期、丰水期发电量,通常情况下采用代表年的测风数据风频矩阵计算风电场全生命周期年平均发电量,计算结果不能区分枯平期、丰水期;若采用时间序列算法,计算结果可统计各月发电量,但往往实测数据仅满一年,时段较短,而降水量也存在年际变化,因此计算结果仍难以代表风电场全生命周期的枯平期、丰水期发电量水平。为相对合理地评估云南结构电价下风电项目枯平期、丰水期发电量,行业内相关专家提出“枯平期发电量占比”的概念,即枯平期发电量占全年的比值,便于在项目投资决策阶段进行分析、评估。
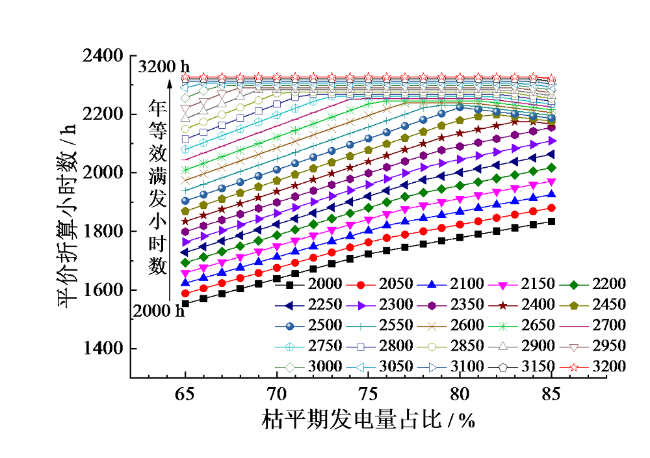
Fig. 1 The influence of power generation proportion change in dry flat period on commutation hours under different annual equivalent generation hours图1 不同的年等效满发小时数下枯平期发电量占比变化对平价折算小时数的影响 |
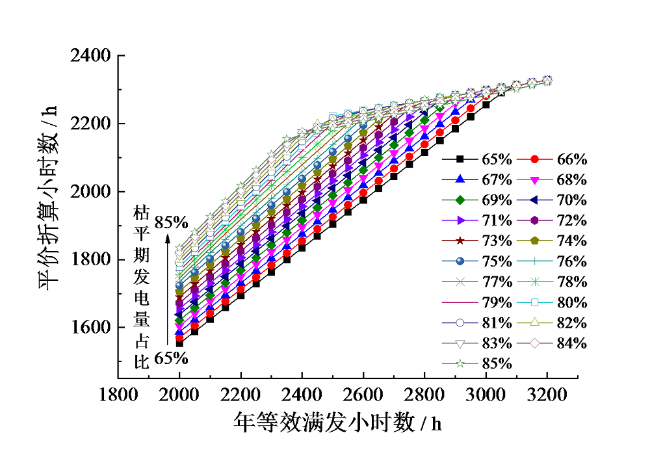
Fig. 2 The influence of annual equivalent power generation hours on commutation hours under different power generation ratios in dry flat period图2 不同的枯平期发电量占比下年等效满发小时数变化对平价折算小时数的影响 |
如图1所示,随着枯平期发电量占比的增大,平价折算小时数变化呈线性增加趋势,以年等效发电小时数2 500 h为例,枯平期发电量占比每提高1%,折算小时数增加25 h,但增加到一定程度后,枯平期发电量占比对平价折算电量影响较小。当发电小时数超过3 075 h后,枯平期发电量占比对平价折算小时数无影响,此时平价折算小时数接近2 300 h。在项目发电量较低的情况下,枯平期发电量占比对折算小时数影响较大。
枯平期发电量占比越大,年等效满发小时数的转折点越早到达,例如当取值79%时,发电小时数超过2 550 h,继续提升发电量对平价折算小时数影响较小。但若风电项目的年等效满发小时数难以达到2 550 h以上时,在评估项目投资收益率时,受结构电价影响,枯平期发电量占全年的比值成为重要的敏感性因素之一。而目前在前期评估类似云南结构电价风电项目的枯平期发电能力时,枯平期发电量占比取值的合理性不足。因每年气候不同,若单以实测时段作为参考或取值过于激进,均会对风电项目的投资收益评估带来较大的不确定性。因此对于风资源评估,在计算风电项目全生命周期的年等效满发小时数的基础上,如何分析、计算风电项目所在区域的枯平期发电量占比也尤为关键[2,3,4,5,6,7]。
以云南某个拟建设的风电项目为例,基于实测数据、中尺度数据库、计算发电量的常用方法及软件等,分析风速、风功率密度的变化规律以及风功率密度、发电量占全年比值的变化,对比采用不同机型计算枯平期发电量占比的变化;探讨采用实测数据插补处理后的长时间序列数据计算风电场枯平期发电量占比的计算方法,并将计算评估值与周边已建成风电场实际枯平期发电量占全年的比值进行对比分析;提出适宜类似云南结构电价下风电项目的枯平期发电量占比计算方法及项目评估、运行建议。
1 项目概况
1.1 项目简介
该拟建设风电项目位于云南省南部红河州境内,场区占地面积约275 km2,海拔介于1 200 ~ 2 100 m之间。项目共有机位86个,场区内共有测风塔12座。具体相对位置关系如图3所示。
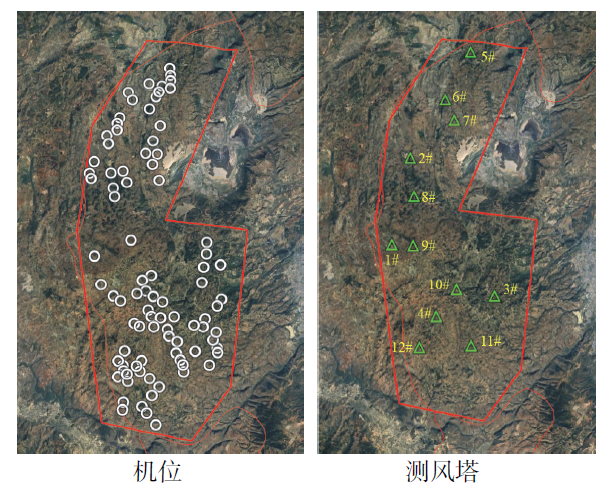
Fig. 3 Schematic diagram of the relative position of project site scope, machine position and wind tower图3 项目场区范围、机位、测风塔相对位置关系示意图 |
1.2 测风塔情况
场区内共有12座测风塔,均有一年以上实测数据,测风塔基本信息如表1所示。
Table 1 The basic information of wind towers表1 测风塔基本信息 |
| 编号 | 塔高 / m | 海拔高度 / m | 数据分析时段 |
|---|---|---|---|
| 1# | 80 | 2 038 | 2013/5/1-2014/4/30,2014/5/1-2015/4/30,2020/5/1-2021/4/30 |
| 2# | 80 | 1 758 | 2014/5/1-2015/4/30 |
| 3# | 80 | 1 865 | 2015/5/1-2016/4/30 |
| 4# | 80 | 1 852 | 2015/5/1-2016/4/30,2020/5/1-2021/4/30 |
| 5# | 100 | 1 677 | 2020/5/1-2021/4/30 |
| 6# | 100 | 1 739 | 2020/5/1-2021/4/30 |
| 7# | 100 | 1 688 | 2020/5/1-2021/4/30 |
| 8# | 100 | 1 844 | 2020/5/1-2021/4/30 |
| 9# | 100 | 1 968 | 2020/5/1-2021/4/30 |
| 10# | 100 | 1 875 | 2020/5/1-2021/4/30 |
| 11# | 100 | 1 842 | 2020/5/1-2021/4/30 |
| 12# | 100 | 1 829 | 2020/5/1-2021/4/30 |
由表1分析可知,1# ~ 4# 测风塔高度为80 m,其中1#、2# 测风塔分别于2013年4月、2014年4月开始测风,3#、4# 测风塔于2015年4月开始测风;1# 和4# 测风塔在2020年4月重新观测,即1#、4# 两座测风塔在同点位处有前后两个时段的测风数据。5# ~ 12# 测风塔高度为100 m,于2020年4月安装完成并开始测风。另外收集到各座测风塔同点位处数据库A、B、C等中尺度数据,便于分析长时间序列的风速、发电量的枯平期变化规律。
2 数据分析
2.1 实测数据分析
由于测风塔实测数据位置、时段、塔高等不同,因此基于实测数据,分别分析100 m高度处“不同塔同期”“同塔不同期”两种情况下的风速、风功率密度等变化(其中,80 m高度测风塔使用风切变指数推至100 m高度后进行数据分析)。
2.1.1 风速
选取项目场区内1#、4#、5# ~ 12# 共10座具有2020/5/1-2021/4/30同时段数据的测风塔,以分析“不同塔同期”情况下风速变化趋势,以上10座测风塔100 m高度风速月变化趋势如图4所示。
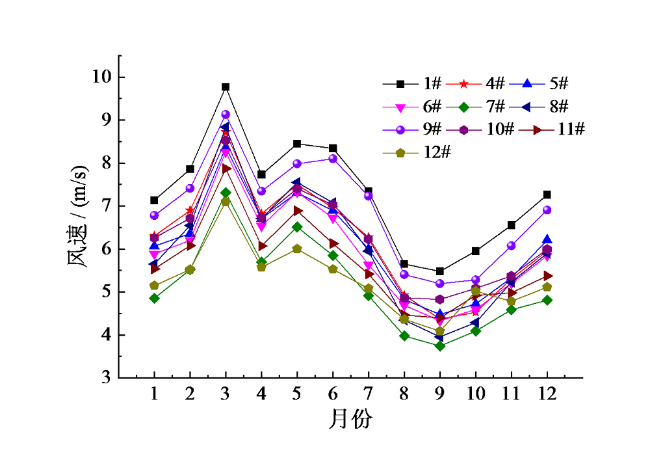
Fig. 4 Monthly variation trend of wind speed at the same height of wind tower from May 2020 to April 2021图4 2020/5/1-2021/4/30同期测风塔相同高度处风速月变化趋势 |
从图4可以看出,相同实测时段内,受地形、海拔等因素影响,测风塔之间风速差异较大,但所有塔平均风速月变化趋势几乎一致,枯平期比丰水期的月平均风速相对较高;2020/5/1-2021/4/30时段内,风速最大的月份为3月,风速最小的月份为9月,其中,2月 ~ 4月、6月 ~ 8月都呈现出较大的风速变化。
项目场区内1# 和4# 两座测风塔分别于2013年4月、2015年4月开始测风,2020年4月在相同位置处更换新设备重新观测,具有同点位、前后不同年份的数据,便于分析“同塔不同期”情况下的风速变化趋势。若忽略前后设备不同等差异,对比1#、4# 测风塔在不同年份的相同高度处风速月变化趋势如图5所示。
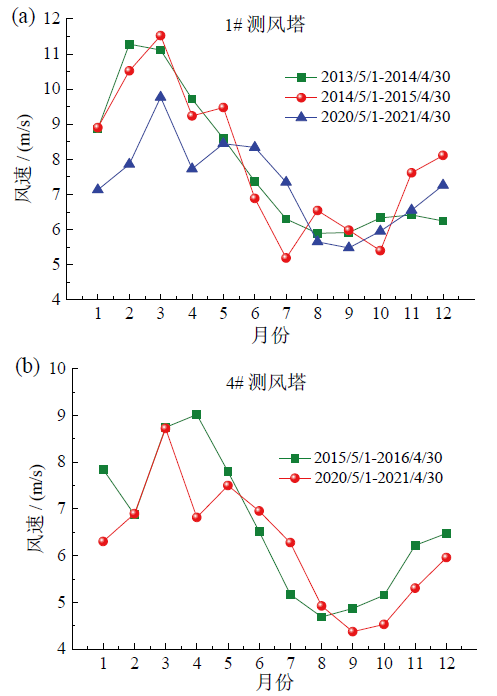
Fig. 5 Monthly variation of wind speed in the same tower at the same height in different years图5 相同测风塔相同高度处在不同年份的风速月变化 |
从图5中相同测风塔、相同高度处在不同年份的风速月变化趋势可以看出,个别月份前后相对大小关系有差异,2014/5/1-2015/4/30和2020/5/1- 2021/4/30两时段内4月平均风速要低于5月平均风速,2014/5/1-2015/4/30时段中8月、9月平均风速均高于7月和10月;但就枯平期、丰水期的月平均风速变化总体趋势上来看,每年基本趋于一致,枯平期风速高于丰水期风速。
2.1.2 风功率密度
风功率密度是在单位时间内垂直通过单位截面积的风能,受风速、风速频率分布和空气密度的影响,是衡量风电场风能资源的综合指标。
除上述分析的风速、风频外,空气密度也是影响风功率密度、发电量的重要参数,其与温度和气压(海拔)有关,也会随季节相应变化,因此,在研究云南结构电价下风电项目枯平期风功率密度、发电量等占比时,需优先分析项目场区空气密度的月际变化。
选取同时段的几座具有较完整气温、气压实测数据的测风塔(安装于每座测风塔8 m高度层),各座测风塔年平均空气密度介于0.959 ~ 0.994 kg/m3,经计算得出实测时段内空气密度月变化趋势如图6所示。
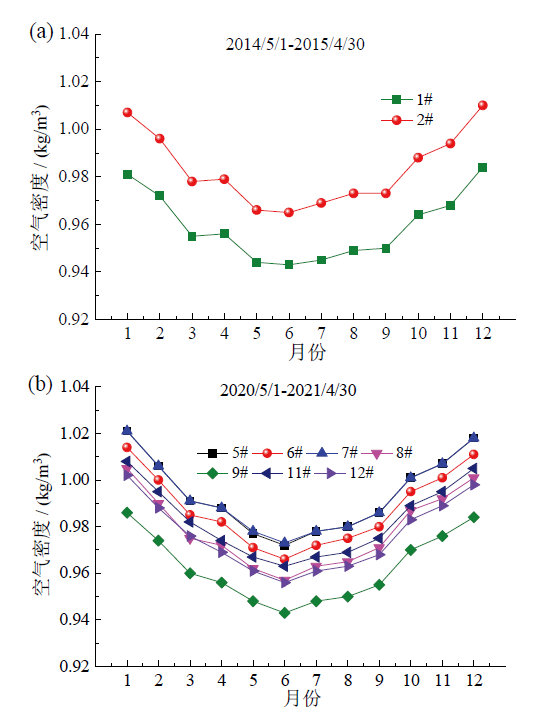
Fig. 6 The wind tower measured the monthly variation of air density during the whole period of the year图6 测风塔实测完整年时段内空气密度月变化 |
从图6可以看出,冬季空气密度高于夏季,一年中空气密度最低的月份与最高的月份相差约0.045 kg/m3,按照云南枯平期、丰水期划分,枯平期空气密度平均值比丰水期高约0.017 kg/m3。对风功率密度、发电量影响较小。为便于分析计算,暂不考虑空气密度的月际变化,以每座塔年平均空气密度作为参考。
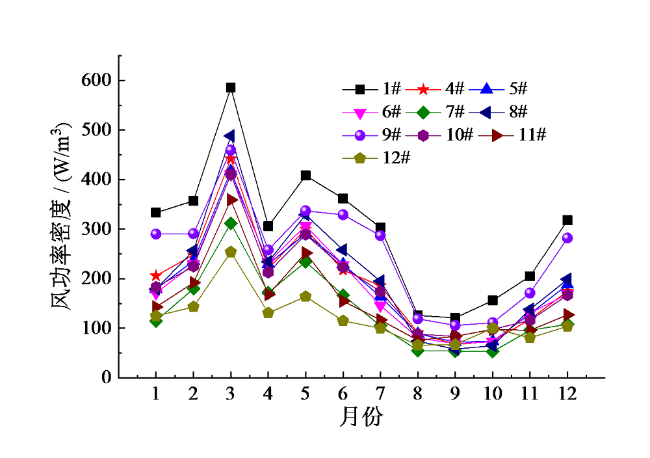
Fig. 7 Monthly variation of wind power density at the same height of wind tower from May 2020 to April 2021图7 2020/5/1-2021/4/30同期测风塔的相同高度风功率密度月变化 |
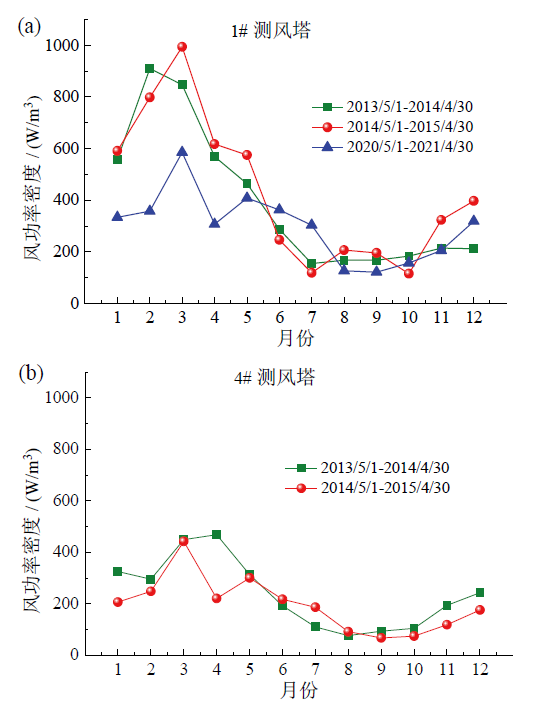
Fig. 8 Monthly variation of wind power density at the same height in the same wind tower in different years图8 相同测风塔在不同年份的相同高度风功率密度月变化 |
从图8分析可知,风功率密度与风速的月变化趋势规律基本一致。相同时段内,测风塔之间风功率密度差异较大,但所有塔风功率密度月变化趋势几乎一致,即枯平期风功率密度平均值比丰水期高;相同测风塔不同实测时段内风功率密度月变化趋势基本一致,但可看出每年枯平期与丰水期的风功率密度差值是变化的,即枯平期风功率密度占全年的比值是波动的。
因此,将上述测风塔各完整年时段内的每月风功率密度按照枯平期、丰水期分别占全年的比值进行计算,结果见表2。
Table 2 The ratio of wind power density of wind towers in dry flat period and wet period during the whole year表2 实测塔各实测完整年内枯平期、丰水期风功率密度占比 |
| 塔号-年份 | 时段 | 平均风速 / (m/s) | 枯平期风功率密度占比 / % | 丰水期风功率密度占比 / % |
|---|---|---|---|---|
| 1#-2013 | 2013/5-2014/4 | 7.83 | 79.75 | 20.25 |
| 1#-2014 | 2014/5-2015/4 | 7.93 | 83.00 | 17.00 |
| 2#-2014 | 2014/5-2015/4 | 6.08 | 84.16 | 15.84 |
| 3#-2015 | 2015/5-2016/4 | 6.42 | 80.30 | 19.70 |
| 4#-2015 | 2015/5-2016/4 | 6.60 | 79.91 | 20.09 |
| 1#-2020 | 2020/5-2021/4 | 7.29 | 70.17 | 29.83 |
| 4#-2020 | 2020/5-2021/4 | 6.21 | 72.91 | 27.09 |
| 5#-2020 | 2020/5-2021/4 | 6.10 | 72.66 | 27.34 |
| 6#-2020 | 2020/5-2021/4 | 5.93 | 73.43 | 26.57 |
| 7#-2020 | 2020/5-2021/4 | 5.15 | 73.71 | 26.29 |
| 8#-2020 | 2020/5-2021/4 | 6.00 | 73.73 | 26.27 |
| 9#-2020 | 2020/5-2021/4 | 6.90 | 68.68 | 31.32 |
| 10#-2020 | 2020/5-2021/4 | 6.25 | 70.62 | 29.38 |
| 11#-2020 | 2020/5-2021/4 | 5.68 | 71.61 | 28.39 |
| 12#-2020 | 2020/5-2021/4 | 5.28 | 69.10 | 30.90 |
从表2可以看出,枯平期风功率密度占全年的比值是有年际波动规律的。以1# 测风塔为例,2013/5/1-2014/4/30、2014/5/1-2015/4/30、2020/5/1- 2021/4/30时段内风功率密度枯平期占比分别为79.75%、83.00%、70.17%;以4# 测风塔为例,2015/5/1-2016/4/30、2020/5/1-2021/4/30时段内风功率密度枯平期占比分别为79.91%、72.91%。
此外,同时段内不同测风塔枯平期风功率密度占比也存在略微差异。2014/5/1-2015/4/30时段,1#、2# 测风塔分别为83%、84.16%;2015/5/1- 2016/4/30时段,3#、4# 测风塔分别为80.3%、79.91%;2020/5/1-2021/4/30时段的10座测风塔枯平期风功率密度占比介于68.68% ~ 73.73%之间。
2.2 中尺度数据分析
通过分析实测数据风速、风功率密度变化趋势,可知枯平期风速大小、风功率密度均具有年际波动规律,以及同时段内不同测风塔枯平期风速大小、风功率密度占比也存在差异。因此,需结合中尺度数据分析长时间序列中枯平期风功率密度占全年比值的年际变化规律。
2.2.1 相关性
中尺度数据即再分析数据,选取三个常用的中尺度数据库,下载与本项目测风塔同点位的各个中尺度数据进行分析,与测风塔实测数据相关性情况见表3。
Table 3 Correlation between measured data and mesoscale data表3 实测数据与中尺度数据相关性 |
| 塔号-年份 | 时段 | 实测数据与中尺度数据相关性 | |||||||
|---|---|---|---|---|---|---|---|---|---|
| R2_数据库A | R2_数据库B | R2_数据库C | |||||||
| 风速 | 风向 | 风速 | 风向 | 风速 | 风向 | ||||
| 1#-2013 | 2013/5-2014/4 | 0.378 | 0.639 | 0.544 | 0.692 | 0.345 | 0.622 | ||
| 1#-2014 | 2014/5-2015/4 | 0.416 | 0.668 | 0.582 | 0.731 | 0.373 | 0.638 | ||
| 2#-2014 | 2014/5-2015/4 | 0.502 | 0.539 | 0.583 | 0.580 | 0.502 | 0.539 | ||
| 3#-2015 | 2015/5-2016/4 | 0.456 | 0.684 | 0.521 | 0.750 | 0.434 | 0.679 | ||
| 4#-2015 | 2015/5-2016/4 | 0.425 | 0.521 | 0.554 | 0.536 | 0.425 | 0.521 | ||
| 1#-2020 | 2020/5-2021/4 | 0.429 | 0.723 | 0.572 | 0.790 | 0.409 | 0.676 | ||
| 4#-2020 | 2020/5-2021/4 | 0.481 | 0.675 | 0.576 | 0.762 | 0.481 | 0.675 | ||
| 5#-2020 | 2020/5-2021/4 | 0.372 | 0.630 | 0.531 | 0.744 | 0.482 | 0.698 | ||
| 6#-2020 | 2020/5-2021/4 | 0.433 | 0.650 | 0.498 | 0.733 | 0.474 | 0.692 | ||
| 7#-2020 | 2020/5-2021/4 | 0.447 | 0.607 | 0.484 | 0.687 | 0.475 | 0.652 | ||
| 8#-2020 | 2020/5-2021/4 | 0.534 | 0.728 | 0.585 | 0.786 | 0.509 | 0.724 | ||
| 9#-2020 | 2020/5-2021/4 | 0.437 | 0.743 | 0.525 | 0.809 | 0.346 | 0.687 | ||
| 10#-2020 | 2020/5-2021/4 | 0.511 | 0.754 | 0.533 | 0.782 | 0.446 | 0.716 | ||
| 11#-2020 | 2020/5-2021/4 | 0.463 | 0.720 | 0.491 | 0.762 | 0.444 | 0.702 | ||
| 12#-2020 | 2020/5-2021/4 | 0.479 | 0.686 | 0.519 | 0.771 | 0.475 | 0.701 | ||
由表3可知,经对比各中尺度数据与实测数据相关性(R2),可知风向的同期相关性相对较好,风速的同期相关性较差。经对比,数据库B与实测数据同期相关性相对较好,风速R2介于0.484 ~ 0.585之间,风向R2介于0.536 ~ 0.809之间,相关性系数均能达到0.7以上。因此,后续分析应优先选取中尺度数据库B作为参考依据。
2.2.2 风功率密度
借助中尺度数据可下载长时间序列的优势,进一步分析枯平期风功率密度占全年的比值年际变化,由于中尺度数据分辨率较差,因此选取场区内相对较远且对局部区域具有代表性的1#、6#、11# 测风塔同点位的中尺度数据,分析近20年中每年枯平期风功率密度占比变化,结果如图9所示。
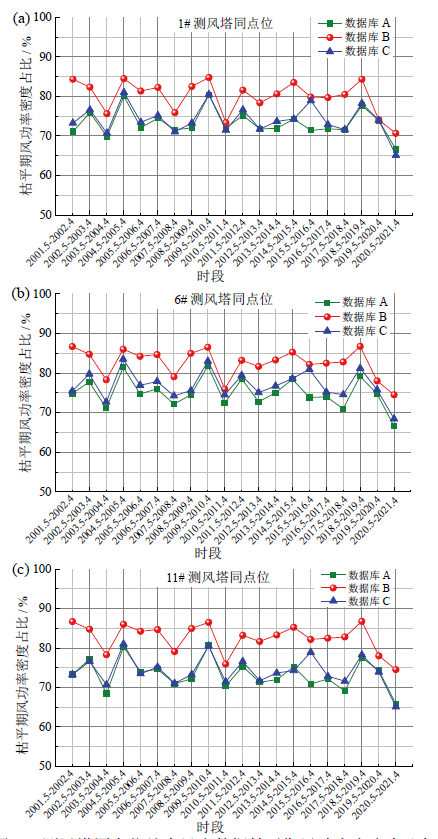
Fig. 9 Interannual variation of mesoscale wind power density ratio at the same point of wind tower in dry flat period图9 测风塔同点位处中尺度数据枯平期风功率密度占比年际变化 |
图9中,每个中尺度数据库近20年中每年枯平期风功率密度占比是波动变化的,其中,数据库A、C相对较接近,大约在75%附近波动;数据库B比值相对偏高,大约在80%附近波动。
3 枯平期发电量占比分析
评估风电项目发电量的另一个主要因素是机型功率曲线,为了探讨该项目在全生命周期的枯平期发电量占比,需要在分析每座测风塔实测完整年枯平期和丰水期的风速、风功率密度的基础上,结合机型功率曲线计算发电量,并分析在长时间序列中每年枯平期发电量占比的变化。
3.1 机型简介
Table 4 The information of wind turbine表4 机型信息 |
| 机型 | 风轮直径 / m | 单机容量 / kW | 单位千瓦扫风面积 / (m2/kW) |
|---|---|---|---|
| WTG191-4.55 | 191 | 4 550 | 6.30 |
| WTG 195-5.0_A | 195 | 5 000 | 5.97 |
| WTG 195-5.0_B | 195 | 5 000 | 5.97 |
| WTG 182-4.65_A | 182 | 4 650 | 5.59 |
| WTG 182-4.65_B | 182 | 4 650 | 5.59 |
| WTG 182-6.25 | 182 | 6 250 | 4.16 |
| WTG 172-6.25 | 172 | 6 250 | 3.72 |
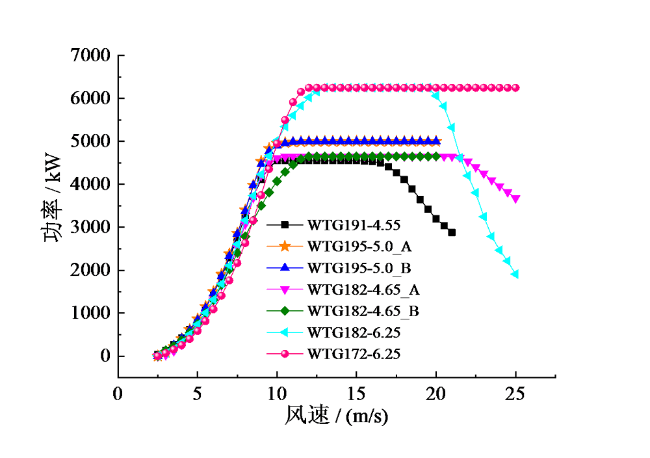
Fig. 10 The power curves of different wind turbine图10 不同机型功率曲线 |
3.2 实测时段单点电量计算
3.2.1 相同测风塔不同时段枯平期发电量占比分析
分析相同测风塔不同时段的枯平期发电量占比如图11所示。以1# 测风塔为例,2013/5/1- 2014/4/30、2014/5/1-2015/4/30、2020/5/1-2021/4/30时段内枯平期发电量占比有较为明显的差异,大约在65% ~ 71%或67% ~ 76%之间;4# 测风塔在2015/5/1-2016/4/30、2020/5/1-2021/4/30时段内枯平期发电量占比同样有较为明显的差异。
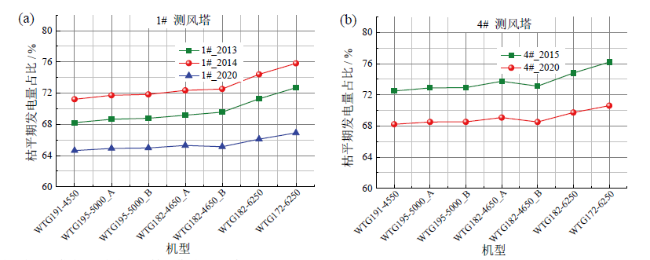
Fig. 11 Power generation ratio of the same wind tower in different periods of dry flat period图11 相同测风塔在不同时段的枯平期发电量占比 |
通过对实测数据、中尺度数据的枯平期风功率密度占全年的比值分析,以及对实测数据不同时段单点发电量枯平期占比的计算分析,可以得出,每年的枯平期发电量占全年发电量的比值是变化的,即在计算项目枯平期发电量占比时应考虑风电场全生命周期的平均水平,而不能仅以某实测时段作为依据。
3.2.2 不同测风塔同时段枯平期发电量占比分析
分析不同测风塔处相同时段的枯平期发电量占比如图12所示。以2020/5/1-2021/4/30时段为例,10座测风塔枯平期发电量存在较明显的差异,介于65% ~ 70%或67% ~ 72%之间。
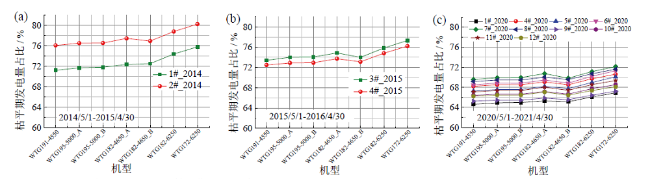
Fig. 12 Power generation ratio of different wind towers in the same period of dry flat period图12 不同测风塔在相同时段的枯平期发电量占比 |
通过对比不同测风塔在同时段内单点发电量枯平期占比,可知位于场区不同位置同年的枯平期发电量占全年发电量的比值也有差异,即在计算项目枯平期发电量占比时应考虑风电场全场机位的平均水平,而不能仅以测风塔作为依据。
3.2.3 采用不同机型时枯平期发电量占比分析
因此,考虑到项目前期测算时寻优选用机型方案,各厂家机型方案单位千瓦扫风面积较接近,枯平期发电量占比变化比例不大,测算时可选用具有代表性的机型计算风电场近20年、全场机位的枯平期发电量占比平均值,以作为评估项目未来全生命周期投资收益的测算依据。
3.3 采用长时间序列数据计算风电场枯平期发电量占比
基于上述分析,选取场区内12座测风塔的完整年测风数据(优先选取每座塔最新时段的第一年)进行处理、分析,结合中尺度数据库B对应点位的长时间序列数据采用同期相关性将实测数据插补至近20年,代入计算全场机位的发电量并得出风电场平均枯平期发电量占比。计算结果如图13所示,近20年每年的枯平期发电量占比呈现在68.78% ~ 81.41%之间波动的趋势。
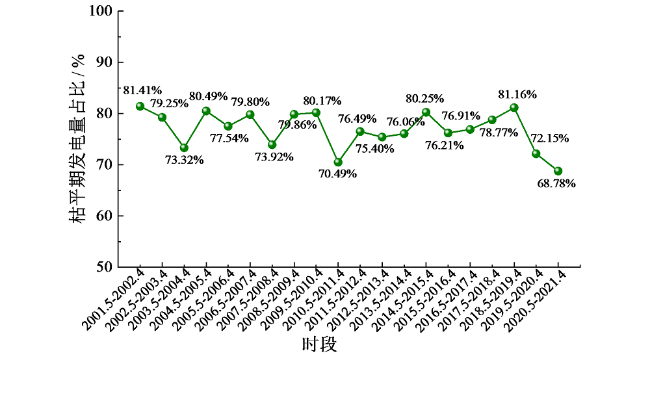
Fig. 13 Proportion of wind farm’s annual power generation during dry flat period in recent 20 years图13 风电场近20年每年枯平期发电量占比 |
4 与附近风电场实发电量对比分析
为了验证采用长时间序列计算近20年每年枯平期发电量占比方法的可行性,收集该项目周边已建成的风电项目近年来实发电量,进行对比分析。
4.1 周边风电场简介
项目周边距离较近的共有4座风电场,其中周边风电场A距离本项目场区较近,周边风电场B、C、D分别距离本项目场区约11 km、24 km、21 km,相对位置关系如图14所示。此外,位于本项目北侧分别约240 km、250 km处也有两座已建成风电场(E、F)的运行数据可供参考。

Fig. 14 The relative position diagram of the project and the surrounding wind farm图14 项目与周边风电场相对位置关系 |
4.2 对比分析
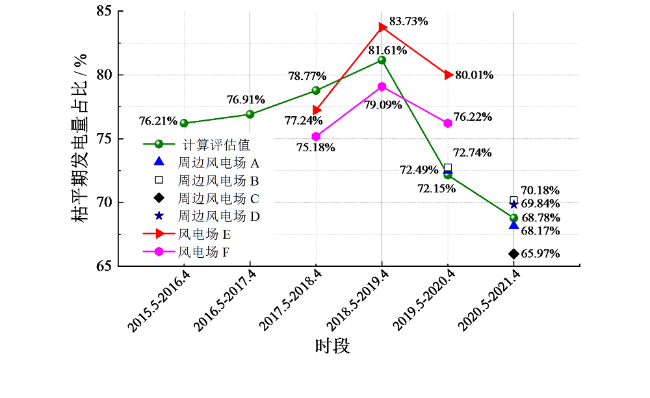
共采集到项目周边距离较近的4座其他风电场近1 ~ 2年的月度实发电量,以及项目北侧约240 km处两座风电场近3年的月度实发电量,分别统计各风电场在完整年时段内枯平期占全年发电量的比值,在假设忽略机型、机位等因素偏差的前提下,与采用长时间序列计算评估得到的本项目各年度枯平期发电量占比进行对比,结果如图15所示。
Fig. 15 The calculated and evaluated value of this project compared with the proportion of power generation during dry flat period of surrounding wind farms图15 项目计算评估值与周边已建成风电场的枯平期发电量占比同期对比 |
由图15可知,距离最近的周边风电场A的近两年实发电量枯平期占比分别为72.49%、68.17%,与计算评估值较接近;其次,周边风电场B、D分别收集到近一年、近两年的实发电量,枯平期占比与计算评估值相比偏差均在1%左右;周边风电场C偏差相对较大,约2.8%。距离最远的风电场E、F与计算评估值相比偏差较大,但在趋势上也较为一致。
综上所述,建议在前期评估类似云南结构电价风电项目的枯平期发电能力时,采用“场区内实测数据结合中尺度数据插补至近20年,长时间序列计算评估项目近20年枯平期发电量占比的平均水平”的方法,评估项目未来全生命周期的枯平期发电量占比。
5 结论及建议
以云南某个拟建设的风电项目为例,研究分析了枯平期风速、风功率密度等参数,对比了相同测风塔不同时段、不同测风塔相同时段以及采用不同机型计算枯平期发电量占比的变化;探讨采用长时间序列数据计算枯平期发电量占比,并与周边已建成风电场实发电量占比进行对比分析;提出云南结构电价下风电项目前期评估时的枯平期发电量占比计算方法及项目评估建议。
5.1 结论
(1)每年枯平期发电量占全年发电量的比值是变化的,即在计算项目枯平期发电量占比时应考虑风电场全生命周期的平均水平,而不能仅以某实测时段作为依据;位于场区不同位置的同年枯平期发电量占全年的比值存在差异,即在计算项目枯平期发电量占比时应考虑风电场全场机位的平均水平,而不能仅以测风塔作为依据。
(2)在前期评估类似云南结构电价风电项目的枯平期发电能力时,建议采用“场区内实测数据结合中尺度数据插补至近20年,长时间序列计算评估项目近20年枯平期发电量占比的平均水平”的方法,评估项目全生命周期的枯平期发电量占比。
(3)考虑到项目前期测算时寻优选用机型方案,各厂家机型方案单位千瓦扫风面积较接近,枯平期发电量占比变化不大,测算时可选用具有代表性的机型计算风电场近20年、全场机位的枯平期发电量占比平均值,以作为评估项目全生命周期投资收益的测算依据。
5.2 建议
通过上述探讨以及得出的相关结论,对类似云南的结构电价项目提出如下建议。
(1)在微观选址阶段,应当选用在位置和时间上对项目场区具有代表性的测风数据评估每个机位处的枯平期发电量占比,在考虑机位发电量、建设成本外,机位的枯平期发电量占比也是优选机位需要顾及的因素。
(2)气候变化、空气密度月际变化、机型方案差异、风资源评估的不确定性等均可能对枯平期发电量占比存在一定的影响,考虑到电价结构的敏感性,因此在风电项目评估时,计算的枯平期发电量占比建议进行敏感性因素分析,以规避项目投资风险。
(3)对于枯平期难以达到2 000 h的项目,项目建成运行后应更合理地安排运行、检修计划,建议为机组制定“劳逸结合”的运行策略,即枯平期可适当超发并减少检修时间[18]。