

0 引言
在我国“2030年碳达峰、2060年碳中和”的低碳发展背景下,新能源技术得到了迅速发展。其中,新能源电动汽车的发展有效地解决了传统汽车带来的能源和环境问题。动力电池作为电动汽车的核心部件之一,其性能很大程度上取决于工作温度。过高的温度会降低该类电池的性能,严重时会导致热失控、爆炸等极端事故。因此如何确保电池在安全的温度范围内运行是一个亟待解决的问题[1]。
目前,电池包不同的热管理策略均得到了快速发展。其中,液冷散热技术因其优异的冷却性能倍受行业的青睐。研究表明,液冷板的设计和部署方式对冷却效率有着显著影响[2,3]。借助不断发展的数值模拟工具,国内外学者对冷却板的优化设计开展了大量的研究工作[4]。结果表明,温度不均匀性对电池包的安全运行和寿命具有显著影响,且当电池在较高电流下工作时,这种不均匀性显著增加。目前,液冷系统的研究主要集中在通道几何参数、冷却板结构、流体流动分布等方面。最近,一些先进的结构设计也被提出,例如叶状通道、微通道和蛇形通道等,为电池散热研究提供了新的方向[5,6,7]。然而,关于液冷散热系统与电池组的流-热-电耦合研究仍然存在局限性[8]。
本文利用数值模拟工具对某纯电动汽车电池包的液冷散热板的性能进行综合评估。首先,利用Fluent软件建立电池组和液冷板的三维稳态模型,分析其在0.5 C和1.0 C工况下液冷板的流场和温度场分布,并讨论电池组内部的温度分布情况。其次,通过COMSOL软件建立电池组内部的热化学模型,探究放电过程对温度场的影响。本研究可为电池包散热结构的优化设计提供参考。
1 数值研究
1.1 设计要求
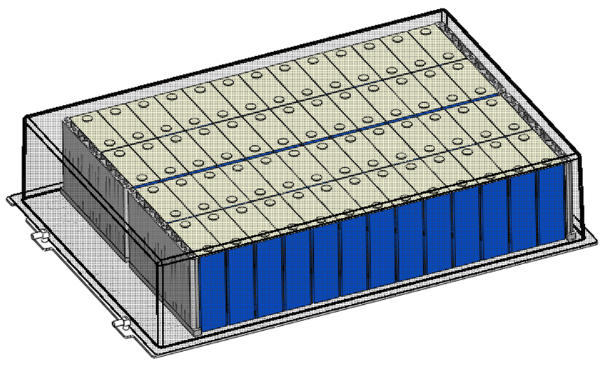
Fig. 1 3D structure of liquid-cooled heat dissipation battery pack图1 液冷散热电池包3D结构 |
Table 1 Structural dimensions and design parameters表1 结构尺寸及设计参数 |
| 项目 | 参数 |
|---|---|
| 电芯类型 | 磷酸铁锂280 Ah方形电芯(质量为5.34 kg) |
| 电芯宽度 | 173.9 ± 0.8 mm |
| 电芯高度 | 71.7 ± 0.8 mm |
| 电芯厚度 | 207.2 ± 0.8 mm |
| 水嘴规格 | CQC14 |
| 冷却介质 | 50%纯水 + 50%乙二醇 |
| 流量 | 5 L/min |
| 进口温度 | 18β℃ |
| 材质 | AL3003 |
1.2 材料设置与边界条件
以电池包在0.5 C和1.0 C运行工况下为例,评估液冷板的热管理能力。针对给定的电芯发热功率进行稳态分析。基于有限体积法的Fluent软件已被证明能够准确模拟该类问题。根据表1给定的设计参数,冷却液为50%乙二醇 + 50%水,液冷板进口给定流量和温度分别为5 L/min和18β℃。冷却液在液冷板通道内的流动属于强制单相对流,其相关控制方程(连续性方程、动量方程、能量方程)可参考Fluent理论手册。出口设定为压力出口边界。为方便研究,整个电池包外部壁面设置成对流换热边界,液冷板与上部盖板为铝制材料,电池模组上壁面与侧壁面被设置成绝热边界。稳态模拟时,假设电芯发热功率与放电倍率呈线性关系,即0.5 C对应的电芯发热功率为12.5 W,1.0 C对应的值为25 W,其他边界条件保持不变。详细边界条件见表2。
Table 2 Boundary conditions of the model表2 模型的边界条件 |
| 参数 | 取值 |
|---|---|
| 环境温度 | 25β℃ |
| 电芯发热功率 | 12.5 W[4 838.4 W(W/m3)] |
| 电芯密度 | 2 000 kg/m3 |
| 电芯比热容 | 967 J/(kg•K) |
| 电芯导热系数(各向异性) | 20 × 20 × 5 W/(m•K) |
| 导热硅胶导热系数 | 1.2 W/(m•K) |
| 冷却液体积流量 | 5 L/min |
| 冷却液流体温度 | 18β℃ |
| 冷却液密度 | 1 066 kg/m3 |
| 冷却液黏度 | 0.003 15 μ/(Pa•s) |
| 冷却液比热 | 3 338 J/(kg•K) |
| 冷却液导热系数 | 0.39 W/(m•K) |
| 液冷板导热系数(铝) | 202.4 W/(m•K) |
| 外部对流换热系数 | 5 W/(m2•K) |
| 接触热阻 | 0.000 1 (m2•K)/W |
在电池系统设计开发过程中,对电芯性能的研究尤为重要。其中,电芯实时产热计算是电池热管理设计非常重要的环节。因此,除了根据给定的发热功率进行稳态计算外,还根据该电池组的工作及热效应原理,采用COMSOL Multiphysics软件建立了该电池的电化学-热-流耦合模型。模型中,使用该电池模块的一维等温模型来计算产热,定量分析不同倍率对电池包温度场分布的影响。根据文献[9],电化学部分边界条件设置如下:电解质由体积比为1∶2的乙烯碳酸脂∶碳酸二甲酯溶剂、2 mol/L LiPF6和偏氟乙烯-六氟丙烯共聚物[p(VDF-HFP)]组成;负极材料为石墨材料,正极材料为LiFePO4;电解质、阴极和正极的厚度根据案例库设置为52、100、174 μm;电极活性面积为16 m2。使用基于欧姆定律的电荷守恒来计算电子导电相中的电位,其中电荷转移反应作为源项或汇项。对于多孔电极的电解质相,使用材料的电导率σm和孔隙率ε来分析有效电导率σm,eff,表达式如下[10]:
${{\sigma }_{\text{m},\text{eff}}}={{\sigma }_{\text{m}}}{{\varepsilon }^{\gamma }} $ (1)
式中:γ为Bruggeman系数,取值3.3;孔隙率ε取值0.4。用相似的方法处理扩散系数。其余参数设置根据COMSOL自带材料库默认设置。在热模型中,温度通过非局部积分耦合设为活性电池材料的平均温度。为了保证数值模拟的准确性和稳定性,该电池的初始荷电状态设为10%,即1.0 C设置为250 A。方波函数用于设置0.5 C/1.0 C放电倍率时的充电/放电电流,循环时间为14 400 s(0.5 C)/7 200 s(1.0 C)。瞬态模拟过程中的电池电势和电流密度变化如图2所示。其余流动和传热边界与稳态计算相同。
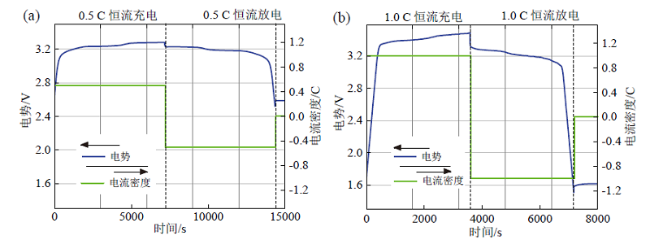
Fig. 2 Battery potential and current under 0.5 C (a) and 1.0 C (b)图2 0.5 C(a)、1.0 C(b)工况下电池电势和电流密度 |
1.3 网格模型与求解
数值模拟结果的准确性极大程度取决于网格质量。由于液冷板内流道的非规则性,该模型采用非结构网格进行划分。整个计算域由固体域和流体域组成(图3),其中固体域由电芯、上部盖板、液冷板、导热硅胶组成,流体域仅包括冷却流体。由于固体域只涉及简单的导热问题,可采用较大的网格进行划分。而流体域内流动与传热问题较为复杂,其网格需进行局部加密处理。同时,为了准确捕获流-固交界面附近的流动与传热特征,使用边界层网格。

Fig. 3 Mesh model图3 网格模型 |
该电池包以冷却流体在液冷板内的流动实现对电芯的冷却,属于强制单相对流换热范畴。经初步计算,冷却液在液冷板内属于湍流流动,本文稳态和瞬态模拟均采用标准的k-ε模型进行模拟。压力速度耦合采用Couple算法,湍流和能量方程采用二阶迎风格式离散。设置三个收敛标准,即各方程的残差小于1 × 10⁻⁶,或冷却液进出口温差和压降不再变化。为优化计算过程,将进出口温度和压差作为监测量,执行网格无关性分析。如表3所示,通过对5组网格模型的计算,采用12 300 100个网格单元。
Table 3 Grid independence verification表3 网格无关性验证 |
| 网格数 | 进出口温差/℃ | 进出口压降/kPa |
|---|---|---|
| 4 826 038 | 2.27 | 12.27 |
| 8 457 454 | 2.20 | 11.98 |
| 11 626 786 | 2.15 | 11.83 |
| 12 300 100 | 2.13 | 11.82 |
| 25 215 104 | 2.13 | 11.82 |
1.4 电化学模型验证
由于目前尚缺磷酸铁锂280 Ah方形电芯的产热实验数据,因此根据文献β[11]β的电芯放电电压-容量曲线对电芯的电化学模型进行验证。如图4所示,建立的电化学模型的放电电压-容量曲线与实验数据比较吻合。由于所有材料参数均为COMSOL材料库经验参数,可以认为所建立的电化学模型能够体现磷酸铁锂280 Ah方形电芯的工作特性。
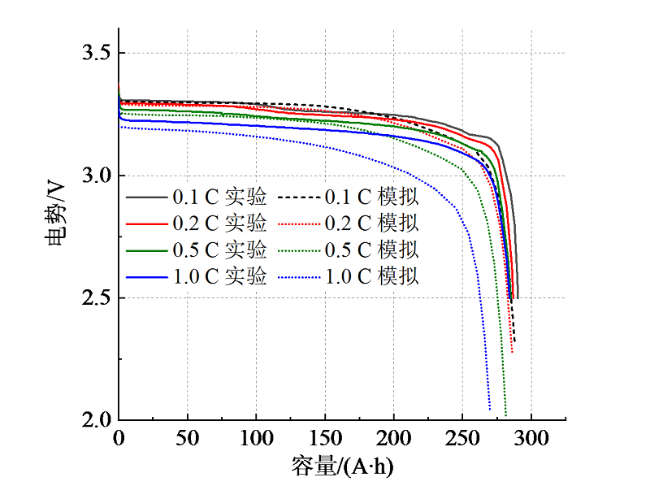
Fig. 4 Validation of electrochemical model图4 电化学模型验证 |
2 结果与讨论
2.1 稳态分析
根据表1中的设计参数,主要讨论两种工况(0.5 C和1.0 C)下电池包内的温度分布,以及流体域内的速度和压力分布。
2.1.1 温度场分析
图5给出了两种工况下电池包的温度云图。两种工况下,电池包进口侧温度明显低于出口侧温度,主要是由于冷却液在进出口处的冷却能力不一致导致的。当放电倍率分别为0.5 C、1.0 C时,电池包的最高温度分别为26.65β℃、33.48β℃。为了观察电池包内部的温度变化,给出了其对应的剖面图。结果显示,当放电倍率为0.5 C时,54块电芯的最大温差为7.52β℃。当放电倍率为1.0 C时,由于电芯发热功率增加,而其他边界条件保持不变,电芯的最大温差为13.40β℃。两种工况下电池包温度均呈现不均匀分布,且这种不均匀性随着功率增加而增加,模拟结果与文献结果一致[12]。严重的温度不均匀性会显著降低电芯的性能,可通过对流体域的优化设计降低温度不均匀性。
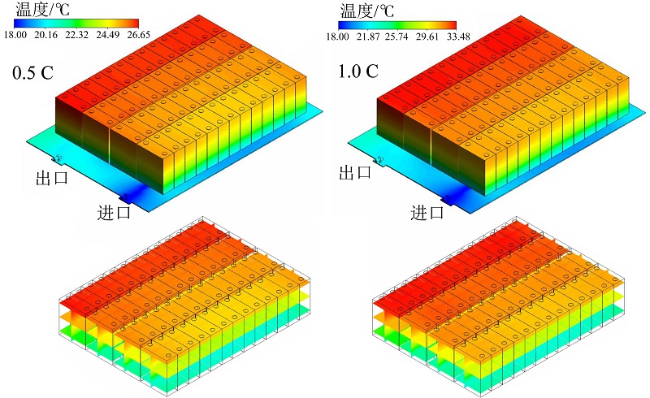
Fig. 5 Comparison of battery pack temperature contours under 0.5 C and 1.0 C图5 0.5 C和1.0 C下电池包温度云图对比 |
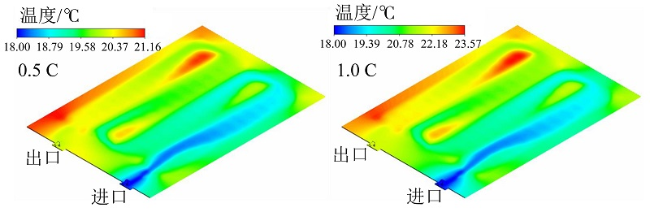
Fig. 6 Comparison of liquid cooling plate temperature contours under 0.5 C and 1.0 C图6 0.5 C和1.0 C下液冷板温度云图对比 |
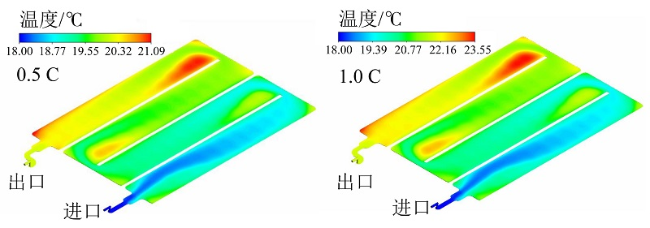
Fig. 7 Comparison of coolant temperature contours under 0.5 C and 1.0 C图7 0.5 C和1.0 C下冷却液温度云图对比 |
2.1.2 速度场分析
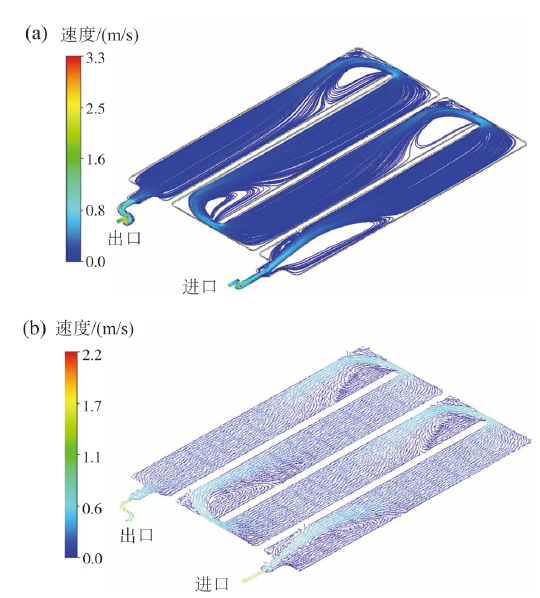
Fig. 8 Coolant streamlines (a) and velocity vector contour (b)图8 流体域内冷却液流线图(a)与速度矢量云图(b) |
2.1.3 压力场分析
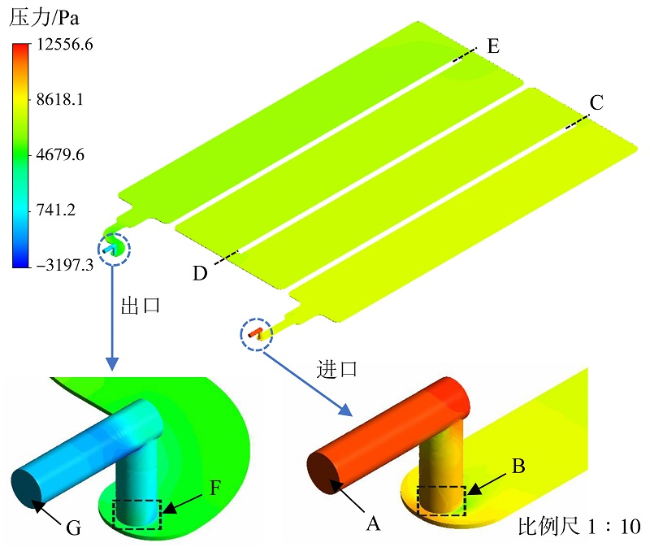
Fig. 9 Coolant pressure contour in the fluid domain图9 流体域内冷却液压力云图 |
Table 4 Pressure at different sections表4 不同截面的压力 |
| 截面 | 压力/kPa |
|---|---|
| A | 11.82 |
| B | 9.71 |
| C | 7.46 |
| D | 7.10 |
| E | 6.46 |
| F | 2.25 |
| G | 0.00 |
2.2 瞬态分析
由于温度对单相液体的流场和压力场几乎没有影响,且流动边界条件并未发生改变,因此稳态和瞬态计算下的流体域具有相同的速度场和压力场。因此本节不再赘述流体域内的速度和压力分布。根据表1中的设计要求,着重讨论两种工况(0.5 C和1.0 C)下电池包内的发热功率和电池温度随时间的变化特性。
如图10所示,电池发热功率在充放电过程中存在差异。在0.5 C工况下,充电时最大发热功率约为3 kW/m3,而放电时最大功率为4.93 kW/m3;在1.0 C工况下,充电时最大发热功率约为14 kW/m3,而放电时最大功率为17.5 kW/m3。结果表明,电池组在放电工况下能达到最大发热功率。发热功率在充电阶段增加率相比放电阶段更快;发热功率在放电初期一直保持在较低水平。综上可知,电池组温度在充电过程比放电过程上升更快。且对比给定的稳态发热功率(0.5 C时发热功率为12.5 W/电池,约4.85 kW/m3),瞬态模拟中的发热功率在0.5 C工况下略低,而在1.0 C工况下略高。由图10还可以看出,由于电池难以达到热稳态(在温度未平衡时即充/放电完毕),因此电池温度在大部分时间比稳态计算时更低。对于0.5 C工况,最高温度为22.32β℃,平均温度最大仅为21.54β℃;对于1.0 C工况,由于发热功率更高,电池温度比稳态计算略高,最高温度在放电过程短时间内达到了35.17β℃,平均温度最高为30.67β℃。
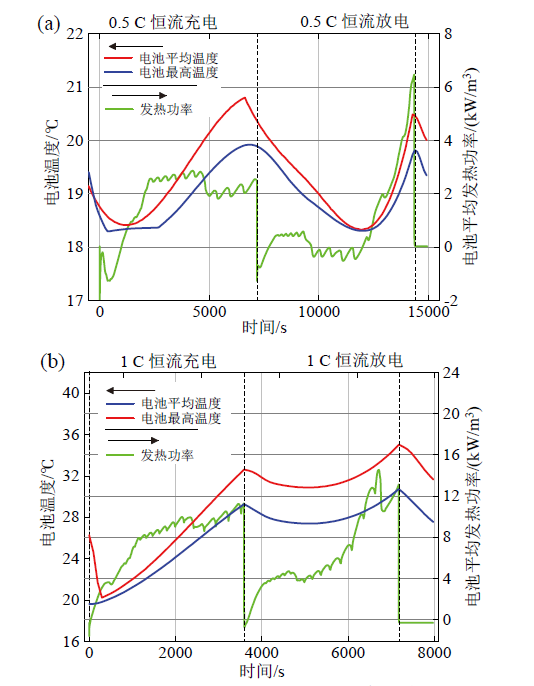
Fig. 10 Comparison of the maximum battery temperature, average battery temperature and heating power under 0.5 C (a) and 1.0 C (b)图10 0.5 C(a)和1.0 C(b)下电池最高温度、电池平均温度和发热功率对比 |
图11展示了两种工况下电芯最高温度时刻的温度分布云图。当放电倍率为0.5 C时,54块电芯在7 200 s时达到最高温度,为22.32β℃,最大温差为2.91β℃。当放电倍率增加到1.0 C时,由于电芯发热功率增加而其他边界条件保持不变,电芯在7 200 s时达到最高温度35.17β℃,最大温差为10.25β℃。
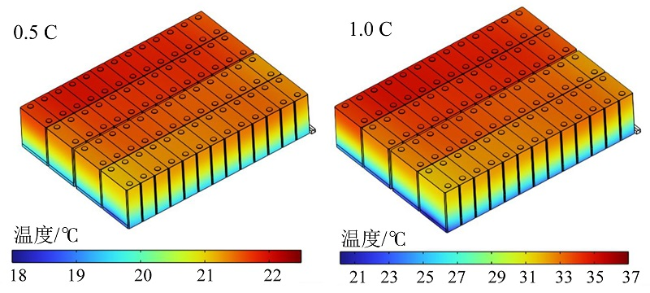
Fig. 11 Comparison of temperature contours at the highest temperature moment of the battery pack under 0.5 C and 1.0 C图11 0.5 C和1.0 C下电池包最高温度时刻温度云图对比 |
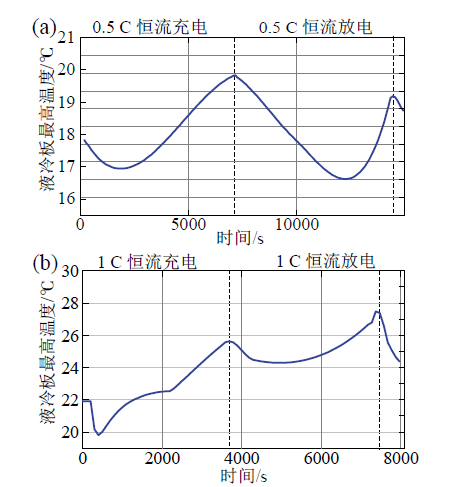
图12展示了液冷板的最高温度随时间的变化情况。当放电倍率为0.5 C时,液冷板最高温度为19.91β℃,最大温差为1.91β℃。当放电倍率为1.0 C时,液冷板最高温度为27.48β℃,最大温差为9.48β℃。
Fig. 12 Comparison of the maximum temperature of the liquid cooling plate under 0.5 C (a) and 1.0 C (b)图12 0.5 C(a)和1.0 C(b)下液冷板最高温度对比 |
3 结论
利用数值模拟软件建立了某磷酸铁锂电池组的热-流-电模型,并对其进行了稳态和瞬态分析。结果显示,冷却液进出口压差达到11.82 kPa,压力损失主要集中在液冷板进出口处,且冷却液存在明显的回流现象。与此同时,电芯温度显示出明显的不均匀性,随着放电倍率的增加,这种不均匀性进一步增强。为了确保电池的稳定工作,优化液冷板时应综合考虑流动压降和温度均匀性。