0 引言
1 地热水回灌与CO2地质封存耦合原理
Fig. 1 Coupling system of geothermal water recharge and CO2 geological storage图1 地热水回灌与CO2地质封存耦合系统 |
2 数值模型建立
2.1 模拟工具
2.2 模型验证
Fig. 2 Gas phase saturation (a) and pressure (b) distribution in the wellbore图2 井筒中气相饱和度(a)和压力(b)分布 |
2.3 区域地质条件与概念模型建立
Table 1 Formation parameters in the model表1 模型中地层参数 |
| 地层 | 层间距/m | 密度/(kg/m3) | φ | κh/m2 | κv/m2 |
|---|---|---|---|---|---|
| A | 0 ~ -1 300 | 2 650 | 0.01 | 1.0 × 10⁻¹⁵ | 1.0 × 10⁻¹⁵ |
| B | -1 300 ~ -1 500 | 2 650 | 0.01 | 1.0 × 10⁻¹⁸ | 1.0 × 10⁻¹⁸ |
| C | -1 500 ~ -1 560 | 2 650 | 0.20 | 6.0 × 10⁻¹³ | 3.0 × 10⁻¹⁴ |
| D | -1 560 ~ -1 760 | 2 650 | 0.01 | 1.0 × 10⁻¹⁸ | 1.0 × 10⁻¹⁸ |
Table 2 Wellbore parameters表2 井筒参数 |
| 参数 | 内管 | 外管 |
|---|---|---|
| 深度/m | 0 ~ 650 | 1 530 |
| 外径/m | 0.10 | 0.15 |
| 热导率/[W/(m∙℃)] | 2.51 | 2.51 |
| 井筒粗糙度/m | 4.6 × 10⁻⁵ | 4.6 × 10⁻⁵ |
Fig. 3 Model overview (Q is the injection rate)图3 模型概况(Q为注入速率) |
2.4 初始条件及边界条件
Table 3 Parameter settings of relative permeability model and capillary pressure model表3 相对渗透率模型和毛细压力模型的参数设置 |
| 模型 | 参数 |
|---|---|
| 相对渗透率函数(Van Genuchten-Mualem和Corey模型) | γ = 0.457 Slr = 0.2 Sls = 1.0 Sgr = 0.05 |
| 毛细压力函数(Van Genuchten) | γ = 0.457 Slr = 0 P0 = 5 000 Pa Pmax = 1 × 10⁷ Pa |
注:γ为形状参数;Slr为残余液体饱和度;Sls为最大液相饱和度;Sgr为残余气体饱和度;P0为进气压力;Pmax为毛细压力最大值。 |
2.5 网格剖分
Fig. 4 Grid profile图4 网格剖面图 |
2.6 模拟方案设计
Table 4 Parameter settings for different cases表4 不同方案的参数设置 |
| 方案 | CO2注入速率/(kg/s) | 混合深度/m | κh/m2 | 备注 |
|---|---|---|---|---|
| 1 | 0.8 | 390 | 6.0 ´ 10-13 | 基础方案 |
| 2 | 0.4 | 390 | 6.0 ´ 10-13 | 评估CO2注入速率的影响 |
| 3 | 0.6 | 390 | 6.0 ´ 10-13 | |
| 4 | 1.0 | 390 | 6.0 ´ 10-13 | |
| 5 | 2.0 | 390 | 6.0 ´ 10-13 | |
| 6 | 3.0 | 390 | 6.0 ´ 10-13 | |
| 7 | 0.8 | 0 | 6.0 ´ 10-13 | 评估混合深度的影响 |
| 8 | 0.8 | 130 | 6.0 ´ 10-13 | |
| 9 | 0.8 | 260 | 6.0 ´ 10-13 | |
| 10 | 0.8 | 520 | 6.0 ´ 10-13 | |
| 11 | 0.8 | 650 | 6.0 ´ 10-13 | |
| 12 | 0.8 | 390 | 3.0 ´ 10-13 | 评估储层渗透率的影响 |
| 13 | 0.8 | 390 | 9.0 ´ 10-13 | |
| 14 | 0.8 | 390 | 1.2 ´ 10-12 | |
| 15 | 0.8 | 390 | 1.5 ´ 10-12 | |
| 16 | 0.8 | 390 | 1.8 ´ 10-12 |
3 结果与讨论
3.1 CO2注入速率
Fig. 5 Effect of CO2 injection rate on water injection pressure (a) and CO2 injection pressure (b)图5 CO2注入速率对注水压力(a)和注CO2压力(b)的影响 |
Fig. 6 Mass fraction distribution of CO2 in liquid phase under different CO2 injection rates (a-f: the CO2 injection rates are 0.4, 0.6, 0.8, 1.0, 2.0, 3.0 kg/s)图6 不同CO2注入速率下液相中CO2质量分数分布(a ~ f:CO2注入速率分别为0.4、0.6、0.8、1.0、2.0、3.0 kg/s) |
Fig. 7 Gas saturation distribution (a-d: the CO2 injection rates are 0.8, 1.0, 2.0, 3.0 kg/s)图7 气体饱和度分布(a ~ d:CO2注入速率分别为0.8、1.0、2.0、3.0 kg/s) |
3.2 混合深度
Fig. 8 Effect of mixing depth on water injection pressure (a) and CO2 injection pressure (b)图8 混合深度对注水压力(a)和注CO2压力(b)的影响 |
3.3 储层渗透率
Fig. 9 Effect of horizontal permeability on water injection pressure (a) and CO2 injection pressure (b)图9 水平渗透率对注水压力(a)和注CO2压力(b)的影响 |
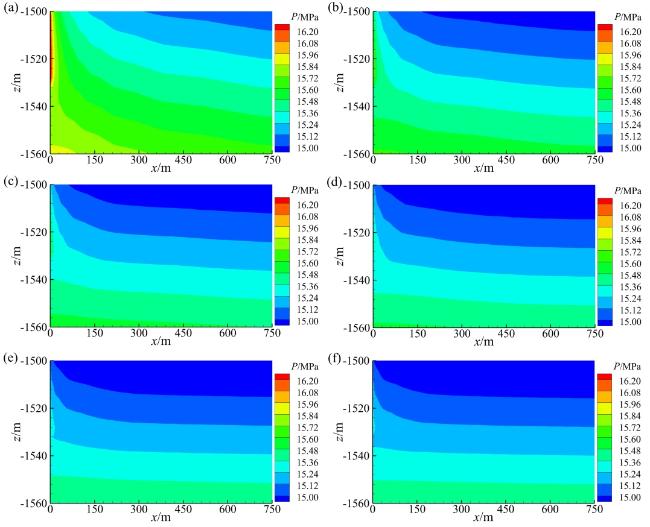
Fig. 10 Effect of horizontal permeability on reservoir pressure (a-f: the κh are 3.0 × 10⁻¹³, 6.0 × 10⁻¹³, 9.0 × 10⁻¹³, 1.2 × 10⁻¹², 1.5 × 10⁻¹², 1.8 × 10⁻¹² m2)图10 水平渗透率对储层压力的影响(a ~ f:κh分别为3.0 × 10⁻¹³、6.0 × 10⁻¹³、9.0 × 10⁻¹³、1.2 × 10⁻¹²、1.5 × 10⁻¹²、1.8 × 10⁻¹² m2) |
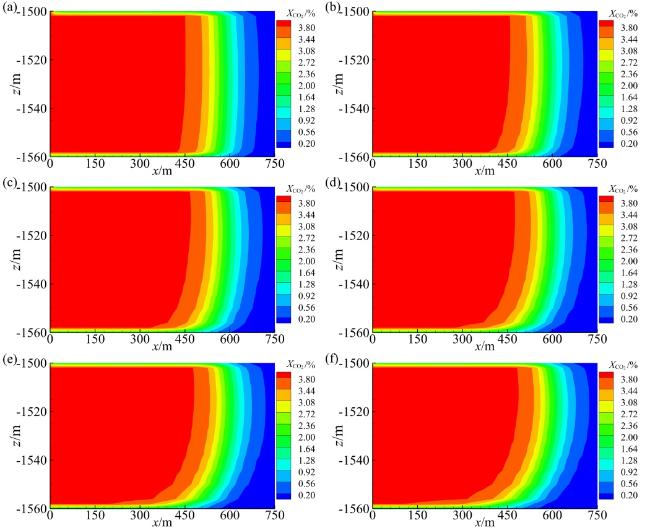
Fig. 11 The effect of horizontal permeability on the mass fraction distribution of CO2 in the liquid phase (a-f: the κh are 3.0 × 10⁻¹³, 6.0 × 10⁻¹³, 9.0 × 10⁻¹³, 1.2 × 10⁻¹², 1.5 × 10⁻¹², 1.8 × 10⁻¹² m2)图11 水平渗透率对液相中CO2质量分数分布的影响(a ~ f:κh分别为3.0 × 10⁻¹³、6.0 × 10⁻¹³、9.0 × 10⁻¹³、1.2 × 10⁻¹²、1.5 × 10⁻¹²、1.8 × 10⁻¹² m2) |


