

0 引言
稀土系AB5型LaNi5储氢合金具有良好的吸/放氢性能与材料循环稳定性,是固态储氢技术研究的常用材料。相关吸/放氢循环实验测试结果表明,该合金在前50次循环吸/放氢实验中材料循环特性几乎无变化,在前100次循环吸/放氢实验中材料特性仅产生微小下降[4]。金属氢化物吸氢过程伴随持续放热现象,温度的急剧上升甚至会导致储氢合金烧结,同时,储氢系统传热效率对金属氢化物吸氢效率具有重要影响[5]。因此,针对储氢系统换热结构进行优化,提高系统换热效率,对提高系统吸氢效率及金属氢化物储氢容器的安全性至关重要[6]。针对储氢系统反应区的换热效率优化问题,EL MGHARI等[7]提出利用相变材料的特性对系统总体能耗进行优化,将吸氢过程产生的热量用于补充放氢过程的热量需求,形成能耗循环。CORGNALE等[8]提出一种蜂窝状储氢反应器设计,在反应区轴向利用蜂窝状散热翅片将反应区分割为多个正六边体,通过蜂窝状翅片网格为系统搭建稳定的换热通道,并进行放氢实验,结果表明在该换热结构条件下,放氢效率得到提高。CHIPPAR等[9]采用分室化的设计方法,将固态储氢系统设计为堆叠式反应床,增大合金与换热区域的接触面,使反应区域内温度分布更均匀。WANG等[10]采用仿生设计理念,在系统反应区径向截面上仿造树干分叉结构建立辐射微通道反应器(radiation mini-channel reactor, RMCR)模型,并通过结构优化,提出带换热夹套的辐射微通道反应器(radiation mini-channel reactor with jacket, RMCR-J),结果表明,RMCR-J能够进一步提高金属氢化物床层的换热效率,并有效解决RMCR外边缘区域的换热不利问题。TAN等[11]和田英等[12]建立了关于LaNi5储氢合金吸/放氢反应的动力学方程,并绘制出不同温度条件下吸/放氢反应的P-C-T曲线,同时对比了不同换热流体下储氢合金和换热结构之间的热交换性能。
上述研究采用了仿生设计、分室设计等方法对固态金属储氢系统换热结构进行优化,进而提升系统储氢性能,为后续开展相关研究提供了重要的理论及实验参考,但相关研究所设定的实验条件不同,未能提供良好的对比效果。在不断深化相关机理的基础上,针对以LaNi5储氢合金为基础的储氢系统开展吸氢反应过程传热传质特性研究,进一步优化储氢系统传热结构进而提高系统储氢效率,对解决氢能源产业集群发展所存在的氢能储运问题具有重要意义。基于以上分析,本文建立了储氢合金反应床数值仿真模型,通过以LaNi5储氢合金为基础的储氢系统吸氢实验验证所建立模型的准确性,并在此基础上针对储氢系统反应床的传热结构进行一系列优化,从而为储氢系统反应床的设计提供参考。
1 合金储氢反应的数值模型
1.1 模型假设
针对基于AB5型储氢合金的吸氢过程进行反应系统整体性能优化,数值模型的构建是对LaNi5储氢合金吸氢过程中反应器内部的物理场进行耦合计算,主要包括以下内容的描述:氢气在合金反应区与上部氢气扩散区的扩张过程;多孔介质的传热过程与换热流体的对流换热过程;流体的动量传递过程;金属氢化物与氢气反应的动力学模型。
为简化模型,提高耦合方程求解效率,对数值模型提出以下假设:①氢气为理想气体,其相关物理量遵循理想气体定律;②储氢合金与氢气之间存在局部热平衡;③储氢合金吸氢所生成的金属氢化物体积膨胀忽略不计;④合金粉末为孔隙率、渗透率等孔隙特性均匀的金属粉末;⑤合金在吸氢过程中孔隙率、渗透率等孔隙特性不变;⑥换热流体为匀速不可压缩流体,流体在流入口的流速和温度为恒定值。
1.2 反应区的守恒方程
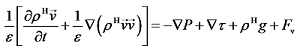
氢气项的质量守恒方程表达式为:
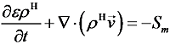
式中:ρH为氢气密度;  为储氢合金孔隙率;
  为氢气速度矢量;Sm为质量源项,其物理意义为单位时间单位体积由气态氢转化为固态金属氢化物所存储的质量。式(1)反映出氢气的质量变化,即氢气的流动与孔隙区域的吸氢反应量。合金项的质量守恒表达式为:
为储氢合金孔隙率; 为氢气速度矢量;Sm为质量源项,其物理意义为单位时间单位体积由气态氢转化为固态金属氢化物所存储的质量。式(1)反映出氢气的质量变化,即氢气的流动与孔隙区域的吸氢反应量。合金项的质量守恒表达式为: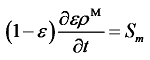
式中:ρM为合金密度。式(1)与式(2)表明,单位时间、单位体积金属氢化物吸氢质量为其密度的变化量,也可由孔隙区域氢气密度变化量与氢气区域氢气的流通量之和来表示。其中,质量源项Sm的表达式如下:
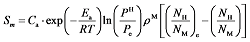
式中:Ca为吸氢速率常数;Ea为吸氢反应的活化能;PH为反应器的内部氢压;Pe为吸氢反应的平衡压强;  为反应平衡时氢原子与金属原子的原子数量比,代表吸氢反应的吸氢量。其中,吸氢反应平衡压强Pe可表示为:
为反应平衡时氢原子与金属原子的原子数量比,代表吸氢反应的吸氢量。其中,吸氢反应平衡压强Pe可表示为: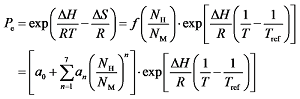
式中:ΔH为吸氢反应的焓变;T为实时温度;ΔS为吸氢反应的熵变;Tref为参考温度;  为插值多项式,其系数为:a0 = -0.348 6,a1 = 10.105 9,a2 = -14.244 2,a3 = 10.353 5,a4 = -4.206 5,a5 = 0.962 4,a6 = -0.115 5,a7 = 0.005 6。
为插值多项式,其系数为:a0 = -0.348 6,a1 = 10.105 9,a2 = -14.244 2,a3 = 10.353 5,a4 = -4.206 5,a5 = 0.962 4,a6 = -0.115 5,a7 = 0.005 6。确定反应区的动量守恒:
式中:  为切应力;Fv为黏性阻力,是由于多孔介质的存在而产生的,代表氢气在多孔储氢合金中流动的动量损失。
为切应力;Fv为黏性阻力,是由于多孔介质的存在而产生的,代表氢气在多孔储氢合金中流动的动量损失。确定反应区的能量守恒:
式中:  为反应区域的总热容;Keff为有效导热系数;Q为吸氢反应过程中释放的热量。仿真模型主要参数见表1。
为反应区域的总热容;Keff为有效导热系数;Q为吸氢反应过程中释放的热量。仿真模型主要参数见表1。| 参数 | 数值 |
|---|---|
| 初始温度T0/K | 293.15 |
| 参考温度Tref/K | 303.15 |
| 吸氢压强Pin/MPa | 1.5 |
| 参考压强Pref/MPa | 1.5 |
| 吸氢速率常数Ca/s | 59.187 |
| 活化能Ea/(J/mol) | 21 179.6 |
氢气热容  /[J/(mol∙K)] /[J/(mol∙K)] | 1 489 |
储氢合金热容  /[J/(mol∙K)] /[J/(mol∙K)] | 419 |
| 氢气导热系数Kg/[W/(m∙K)] | 0.167 |
| 合金导热系数Ks/[W/(m∙K)] | 1.3 |
| 储氢合金孔隙率ε | 0.65 |
| 孔隙区渗透率k/m2 | 1 × 10⁻⁸ |
| 冷却温度Ts/K | 293.15 |
合金密度  /(kg/m3) /(kg/m3) | 8 300 |
饱和合金密度  /(kg/m3) /(kg/m3) | 8 428 |
所建立的LaNi5储氢合金吸氢反应数值模型表明,AB5型固态储氢系统吸氢过程受系统温度与压力影响较大,如何快速降低系统反应区因吸氢反应过程中不断释放的热量所造成的区域高温,为系统吸氢反应提供适宜的均匀的低温环境,是达到相应压力条件下吸氢反应平衡状态的关键。
1.3 模型验证
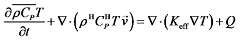
为了验证吸氢模型的准确性,搭建了如图1所示的以小型罐式固态金属氢化物储氢反应床为核心的实验平台,图1(a)为该平台整体构造,图1(b)为参照实验平台储氢罐实物所建立的用于模型验证的储氢罐模型。实验平台以氢气瓶为氢源并通过减压阀控制供氢压力,采用温度变化误差为 ±0.05β℃的恒温水槽与透明水浴箱组合为循环水浴系统,为储氢罐提供稳定的换热环境。在不锈钢储氢罐壁面选取测点排布热电偶,用以实时测量反应床在吸氢实验过程中的壁面温度变化,并将实验数据实时采集输入计算机。为了提高实验数据的准确性,该热电偶需要用隔热胶布紧密粘贴于储氢罐壁面。同时参考实验平台的储氢罐几何尺寸与换热环境建立相应模型并在相同压力与温度条件下进行仿真,对高为120 mm测点处数据进行采集,用以对比分析。本实验平台所用固态金属储氢罐主要参数见表2。
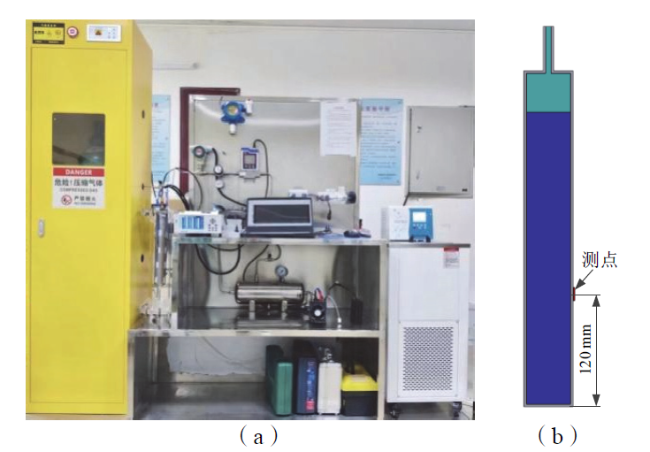
Fig. 1 Schematic structure of the validation model: (a) test platform for hydrogen absorption/release performance of solid metal hydrogen storage system; (b) simulation verification model图1 验证模型结构示意图:(a)固态金属储氢系统吸/放氢性能测试平台;(b)仿真验证模型 |
Table 2 Main parameters of solid metal hydrogen storage tanks表2 固态金属储氢罐主要参数 |
| 参数 | 数值(材质) |
|---|---|
| 罐体材料 | 不锈钢 |
| 罐体尺寸/mm | ϕ56 × L380 |
| 罐体壁厚/mm | 3 |
| 导热系数/[W/(m∙K)] | 14.6 |
| 热通量/(W/m2) | 1 671.02 |
| 储氢材料 | LaNi5 |
| 储氢材料含量/kg | 5 |
| 额定储氢量/L | 560 |
| 接口尺寸/mm | 6 |
| 充氢压力/MPa | 1.5~2.5 |
| 放氢出口压力/MPa | 0.2~1.0 |
Fig. 2 Comparative analysis of simulation results and experimental results图2 仿真模拟结果与实验结果对比分析 |
2 罐式反应器仿真模拟结果与讨论
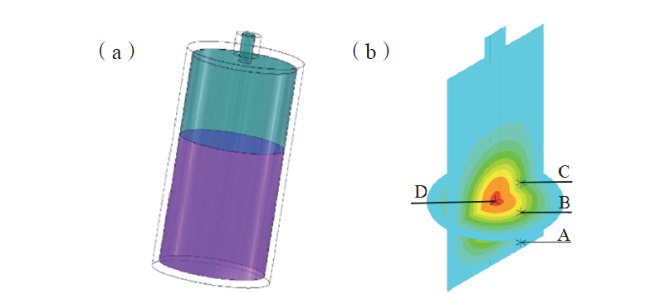
Fig. 3 Tank reactor: (a) reactor model; (b) temperature measurement point selection图3 罐式反应器:(a)反应器模型;(b)测温点选取 |
Table 3 Main parameters of tank reactor simulation表3 罐式反应器仿真主要参数 |
| 参数 | 数值(材质) |
|---|---|
| 罐体尺寸/mm | ϕ56 × L116 |
| 罐体壁厚/mm | 3 |
| 储氢材料 | LaNi5 |
| 储氢材料含量/kg | 1 |
| 吸氢压强/MPa | 1.5 |
| 初始温度/K | 293.15 |
图4为罐式反应器吸氢反应仿真结果曲线,结合图5分析,结果表明,罐式固态储氢系统在设定参数条件下快速持续发生吸氢反应并在60 s内达到温度峰值。在吸氢反应过程中,传热中心D与测点A、B、C相比换热缓慢,各测点温度与系统反应区平均温度存在较大差异,系统反应区温度呈逐层向内降低趋势;反应区吸氢原子分数分布呈逐层向内递增趋势,表明前期吸氢反应主要集中在靠近罐体壁面的外层范围,其中心区域吸氢原子分数在反应前800 s无明显提高,原因在于罐体内部无换热结构且储氢材料导热系数偏低,而边缘区域合金与罐体壁面接触,换热效率更高。根据仿真结果可知,罐式反应器吸氢反应过程存在明显的温降与吸氢不均匀性,造成其内部长期维持高温环境,阻碍了中心区域吸氢反应的进行。
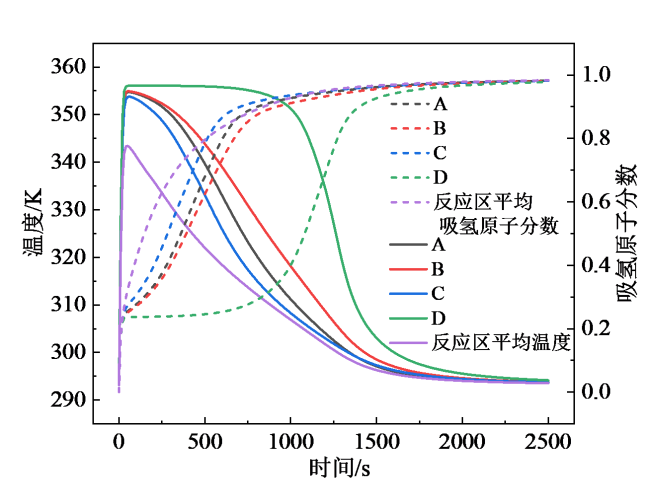
Fig. 4 Simulation results of tank reactor图4 罐式反应器仿真结果 |
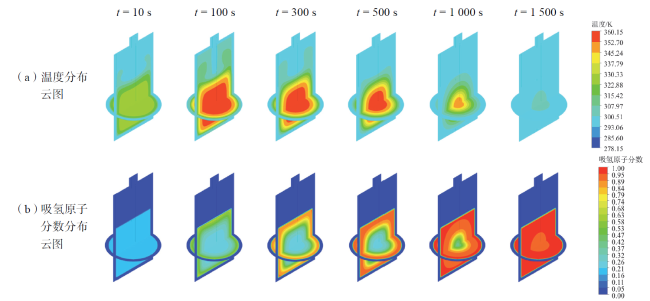
Fig. 5 Simulation of hydrogen adsorption reaction in tank reactors图5 罐式反应器吸氢反应仿真模拟云图 |
3 系统传热结构优化与仿真模拟
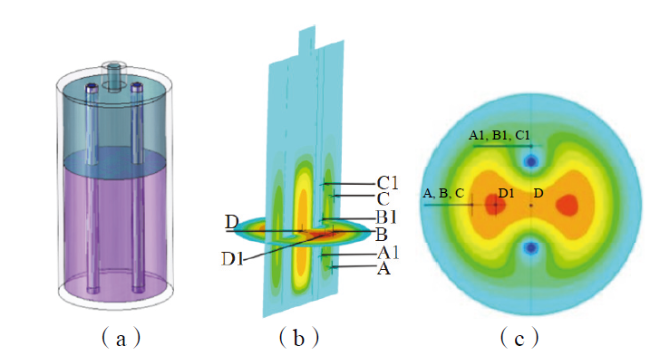
Fig. 6 Double cooling tube reactor: (a) reactor model;(b) temperature measurement point selection; (c) temperature measurement point location图6 双冷却管反应器:(a)反应器模型;(b)测温点选择;(c)测温点位置 |
参考罐式反应器的测温点选取并结合冷却管排布规律,分别在距离反应区圆心15 mm并在反应区轴向以间隔15 mm的规律在互相垂直的两个轴向切面上选取6个测温点,分别标记为A、B、C、A1、B1、C1;同时取原传热中心D及因双冷却管的加入形成的对称传热中心之一D1,共8个测温点作为分析对象。
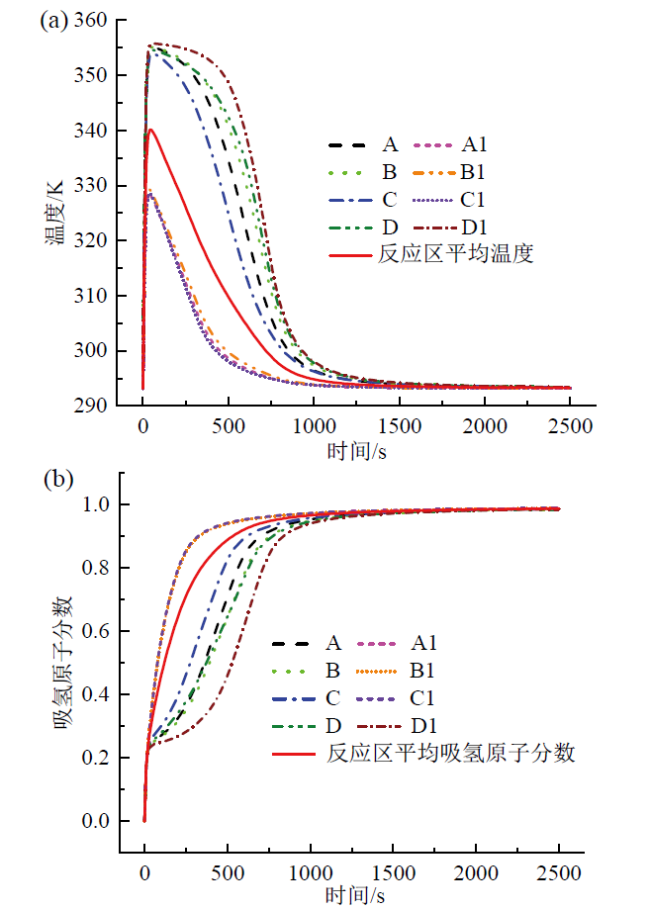
Fig. 7 Simulation results of double cooling tube reactor:(a) temperature curves; (b) atomic fraction curves图7 双冷却管反应器仿真结果:(a)温度曲线;(b)原子分数曲线 |
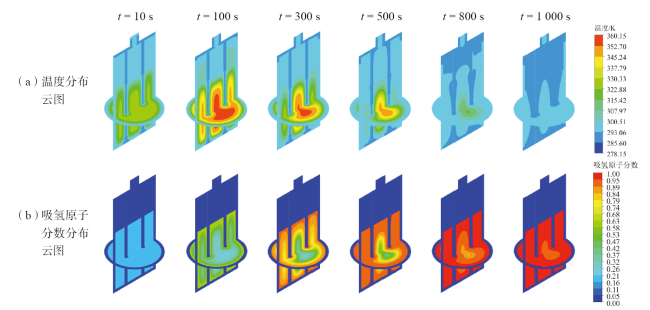
Fig. 8 Simulation of hydrogen adsorption reaction in a double cooling tube reactor图8 双冷却管反应器吸氢反应仿真模拟云图 |
针对双冷却管反应器换热结构空间排布不均导致系统不同区域反应温降效率与吸氢效率差异大的现象,在双冷却管反应器的基础上增加冷却管的数量,设计了四冷却管反应器模型并在相同参数条件下进行仿真模拟,并根据四冷却管的空间排布规律,分别选取A、B、C、D、D1共5个测温点,具体结构如图9所示。
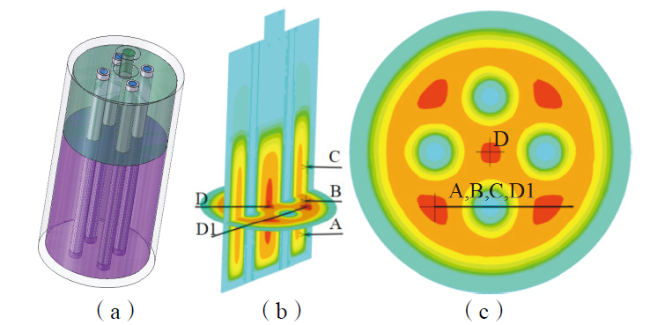
Fig. 9 Four cooling tube reactor: (a) reactor model; (b) temperature measurement point selection; (c) temperature measurement point location图9 四冷却管反应器:(a)反应器模型;(b)测温点选择;(c)测温点位置 |
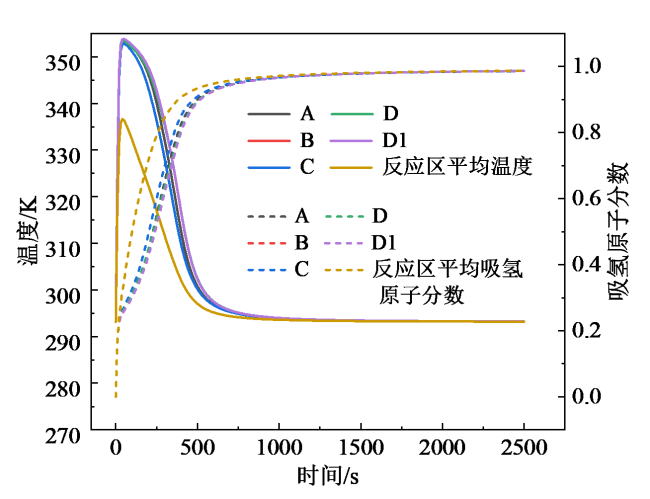
Fig. 10 Simulation results of four cooling tube reactor图10 四冷却管反应器仿真结果 |
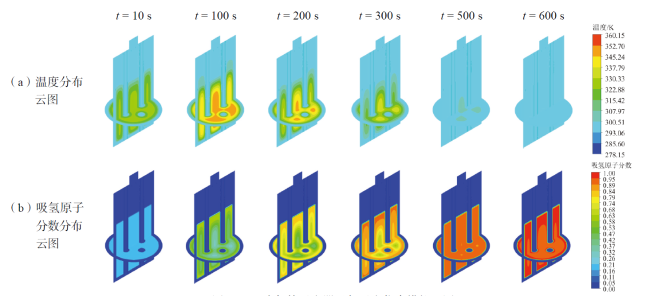
Fig. 11 Simulation of hydrogen absorption reaction in a four cooling tube reactor图11 四冷却管反应器吸氢反应仿真模拟云图 |
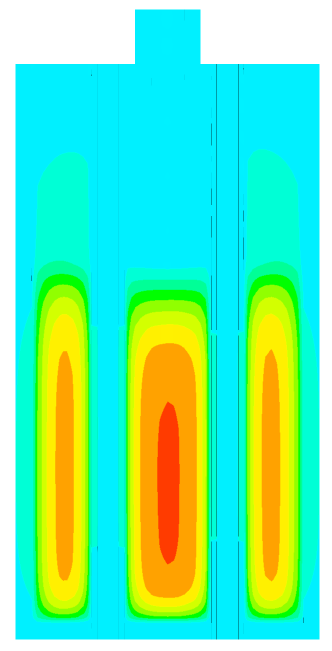
Fig. 12 Axial section of a four cooling tube reactor图12 四冷却管反应器轴向切面 |
综合以上研究结果,确定了一种四冷却管并加装传热翅片的固态储氢反应器——优化方案A。如图13(a)所示,四根冷却管可保证在罐式反应器内部均匀排布。为了进一步提高换热结构对反应区边缘区域温度的控制并参考分室设计理念,在冷却管上加装三层散热翅片,将合金区均匀分割为4层,避免反应区轴向由于纵深过大而导致传热缓慢,散热翅片中心保留直径6 mm的通气孔,散热翅片的加入进一步为系统反应区提供稳定的传热通道。
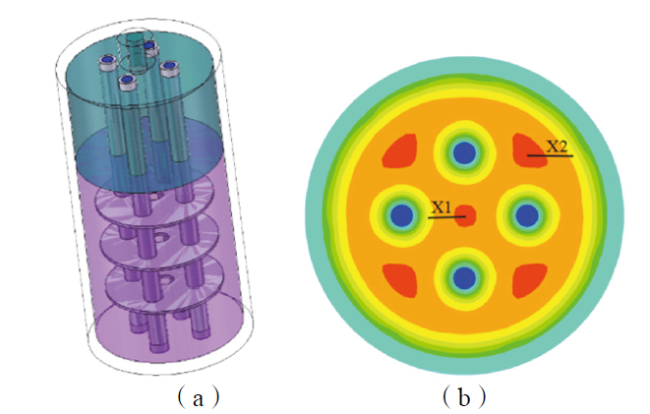
Fig. 13 Schematic diagram of the structure of optimized scenario A: (a) reactor model; (b) temperature measurement point selection图13 优化方案A结构示意图:(a)反应器模型;(b)测温点选取 |
如图13(b)所示,由于冷却管的均匀排布,系统内部反应区径向被划分为5份,分别为几何中心区域与外围四份区域,径向同时产生了5个传热中心,分别选取几何中心所在的传热中心区域X1与外围四分之一传热中心区域X2共两个测温点进行讨论与分析。结合前文的仿真结果,该方案的仿真初始温度为293.15 K,冷却管直径为6 mm,壁厚为1 mm;散热翅片直径为40 mm,厚度为1 mm;冷却水流温度为293.15 K,流速为0.5 m/s。
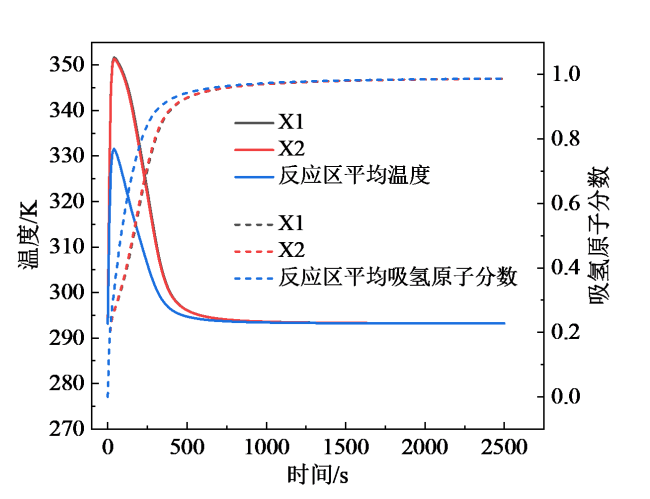
Fig. 14 Simulation results of optimized scenario A图14 优化方案A仿真结果 |
如图15所示,在该传热结构下,系统整体温度分布与吸氢反应表现更均匀,更有利于避免温度不均给系统带来的安全性问题,同时利于储氢合金保持良好的材料循环稳定性。结果显示,系统在630 s内基本恢复初始温度293.15 K,为反应区提供良好的吸氢反应所需的低温环境,进而提高反应区吸氢效率。
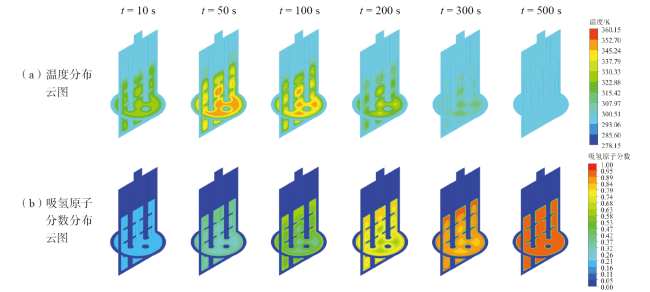
Fig. 15 Simulation cloud diagram of optimized scenario A图15 优化方案A仿真模拟云图 |
为进一步强化换热结构对系统反应区边缘区域的温度控制,在优化方案A的基础上对传热翅片结构进行优化得到优化方案B,如图16(a)所示,增大传热翅片厚度并将其设计为空心结构,使其具有冷却水流通的作用,进一步发挥冷却水流的换热效率。该设计方案下,传热翅片设计为直径40 mm、高4 mm、壁厚1 mm的环状冷却管;配合直径6 mm、壁厚1 mm的铜质冷却管,在0.5 m/s的冷却水流速条件下为系统反应区快速换热。参考优化方案A的测点选取,对优化方案B内、外传热中心X1、X2进行分析讨论。
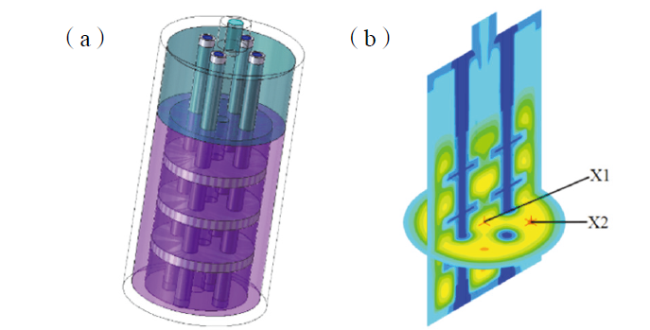
Fig. 16 Structure of optimized scenario B: (a) reactor model; (b) temperature measurement point selection图16 优化方案B结构:(a)反应器模型;(b)测温点选取 |
为进一步研究冷却温度对系统吸氢效率的影响规律,在优化方案B的仿真中对冷却温度参数进行设计,利用该结构在相同的吸氢条件下分别进行冷却温度293.15、288.15、283.15、278.15 K共四组仿真模拟。
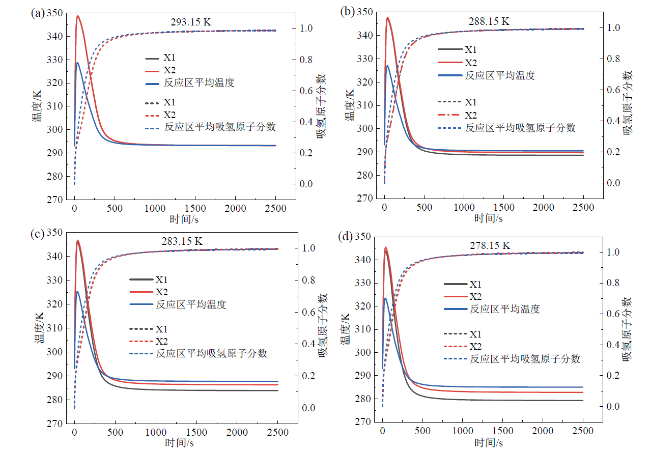
Fig. 17 Temperature and atomic fraction curves of the hydrogen absorption reaction at different cooling temperatures of optimization scenario B图17 优化方案B在不同冷却温度下的吸氢反应温度曲线和原子分数曲线 |
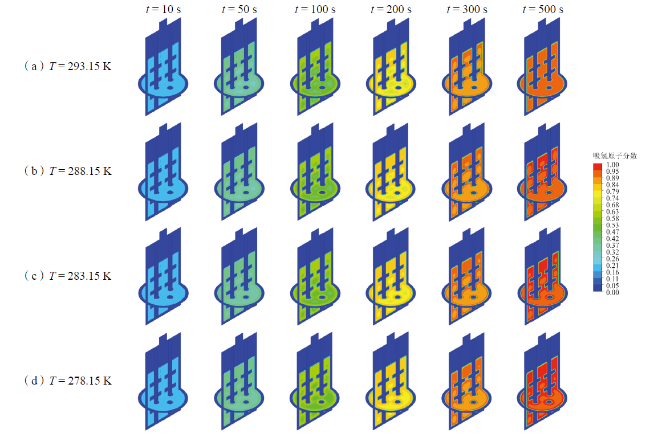
Fig. 19 Simulation hydrogen-absorbing atom fraction cloud diagram of optimized scenario B图19 优化方案B仿真模拟吸氢原子分数分布云图 |
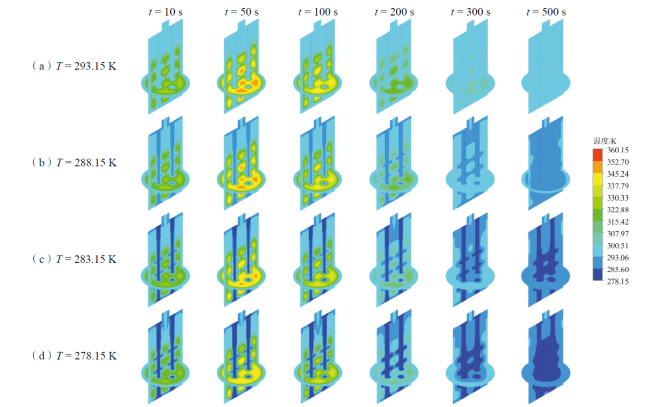
Fig. 18 Simulation temperature distribution cloud diagram of optimized scenario B图18 优化方案B仿真模拟温度分布云图 |
综合研究结果,对各方案吸氢反应过程中反应区平均温度曲线与平均吸氢原子分数曲线进行对比分析。由图20可知,随着系统反应区换热面积的增大,系统温降效率不断提高,温度峰值也随之下降,有利于保持储氢材料的良好循环特性,延长其使用寿命,也为相关技术的实际应用降低工艺要求;同时,系统吸氢效率得到提高,在优化方案B的结构设计条件下,吸氢反应主要阶段集中于反应前350 s,可为固态储氢系统的快充研究提供参考;随冷却温度的降低,优化方案B系统温降效率得到提高,可为系统快速营造吸氢反应所需的低温环境,但仿真结果显示,该条件下系统吸氢效率无明显提高。
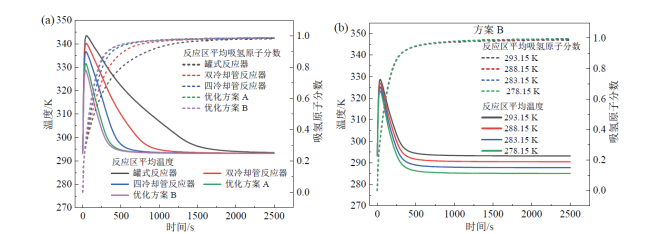
Fig. 20 Curves of average reaction zone temperature and average hydrogen-absorbing atom fraction in the reaction zone for each scheme at 293.15 K (a) and scenario B at different cooling temperatures (b)图20 各方案在293.15 K下(a)及方案B在不同冷却温度下(b)的反应区平均温度及反应区平均吸氢原子分数曲线 |
Table 4 Statistical data for different scenarios表4 各方案数据统计 |
| 方案名称(冷却条件) | 方案代号 | 温降时长/s | 吸氢时长/s |
|---|---|---|---|
| 罐式反应器 | 0 | 2 030 | 1 200 |
| 双冷却管反应器 | 1 | 1 200 | 790 |
| 四冷却管反应器 | 2 | 800 | 620 |
| 优化方案A | A | 630 | 560 |
| 优化方案B(293.15 K) | B293 | 580 | 550 |
| 优化方案B(288.15 K) | B288 | 350 | 530 |
| 优化方案B(283.15 K) | B283 | 290 | 520 |
| 优化方案B(278.15 K) | B278 | 250 | 520 |

Fig. 21 Temperature drop duration and hydrogen absorption duration for each scenario图21 各方案温降时长与吸氢时长对比 |
结果显示,与罐式反应器相比,双冷却管反应器系统反应区的换热效率有明显提高,但在空间排布上不均匀,导致系统温度分布产生较大差异,阻碍相应区域的吸氢反应;四冷却管反应器未能有效解决系统反应区轴向传热缓慢问题,同时缺乏对边缘区域温度的有效控制,导致该区域依旧存在换热缓慢现象;优化方案A与方案B针对换热结构空间排布问题与边缘区域温度控制问题进行了结构优化,与罐式反应器相比,系统温度峰值显著降低且整体温降效率与吸氢效率大大提高,呈现均匀温降与均匀吸氢现象,随着冷却温度的降低,优化方案B的温降效率得到显著提高。在储氢合金装填量(1 kg)与吸氢条件下(吸氢压力1.5 MPa,初始温度293.15 K,冷却温度293.15 K,罐体尺寸与材料一致),随着换热面积的增大,系统吸氢效率得到提高。与罐式反应器相比,优化方案B温降效率与吸氢效率分别提高71.43%与54.17%;在不改变其他参数的条件下,优化方案B以5 K的梯度降低冷却水温度,随着冷却温度降低,系统温降效率明显提高,但对系统吸氢效率无明显影响,表明在该方案的换热结构条件下,冷却温度参数已基本无影响。
4 结论
建立了金属氢化物固态储氢系统实验平台,并验证了LaNi5储氢合金吸氢数值模型的可靠性与准确性,在确定该模型能够真实反映LaNi5储氢合金吸氢反应过程前提下,对罐式固态储氢反应器进行系统传热结构优化,探索传热效率对系统吸氢效率的影响规律,通过不同传热结构的对比分析,结论如下:
(1)换热面积的增大与换热效率的提高对系统吸氢效率具有重要影响。随着换热面积的增大,系统温降效率显著提高,利于系统反应区持续进行均匀、快速的吸氢反应。仿真结果显示,相同条件下优化方案B与罐式反应器相比温降效率与吸氢效率分别提高71.43%与54.17%。
(2)适宜的换热结构可弱化温度参数对系统吸氢反应的影响。仿真结果表明,在优化方案A与优化方案B的结构设计下,可为系统反应区轴向与径向提供有效的换热通道,该条件下,系统吸氢时长随冷却温度降低维持在560~520 s,对系统吸氢效率影响降低。
(3)良好的换热环境利于系统各区域吸氢反应均匀进行。对比优化方案B与其他方案,系统反应区平均吸氢原子分数分布有效规避了区域差异化问题,各区域吸氢反应基本一致,有利于保持储氢合金良好的循环特性,延长使用寿命。