0 引言
1 数值模式及评估指标
1.1 “沙戈荒”风电基地及测风数据
1.2 WRF模式配置方案
Fig. 1 Geographic distribution and topographical features of the Gobi desert wind farm, along with the three nested domain in WRF model图1 “沙戈荒”风电基地地理分布、地形特征及WRF模式的三层嵌套区域 |
Table 1 The configuration of the physical parameterization schemes in WRF model表1 WRF模式的相关大气物理参数化方案设置 |
| 嵌套区域 | 分辨率/km | 网格数 | 行星边界层 | 地表参数化 | 长波辐射 | 短波辐射 | 积云参数化 | 陆面模型 | 微物理过程 |
|---|---|---|---|---|---|---|---|---|---|
| D01 | 9 | 150 × 150 | MYNN2 | MYNN | RRTM | Dudhia | KF | Noah | WSM6 |
| D02 | 3 | 175 × 181 | MYNN2 | MYNN | RRTM | Dudhia | — | Noah | WSM6 |
| D03 | 1 | 151 × 94 | MYNN2 | MYNN | RRTM | Dudhia | — | Noah | WSM6 |
| D04 | 1 | 70 × 90 | MYNN2 | MYNN | RRTM | Dudhia | — | Noah | WSM6 |
1.3 评估指标


1.4 大气稳定度及其分类

Table 2 The classification of atmospheric stability表2 大气稳定度分级 |
| 大气稳定度分级 | L/m | (1/L)/m-1 |
|---|---|---|
| 强不稳定 | -100 < L < 0 | 1/L < -0.01 |
| 不稳定 | -200 < L ≤ -100 | -0.01 ≤ 1/L < -0.005 |
| 中性 | |L| ≥ 200 | -0.005 ≤ 1/L < 0.005 |
| 稳定 | 100 < L ≤ 200 | 0.005 ≤ 1/L < 0.01 |
| 强稳定 | 0 < L ≤ 100 | 1/L ≥ 0.01 |
2 结果与讨论
2.1 WRF模式验证分析
Table 3 The metrics of the comparison of simulated wind speed from WRF model and measured wind speed from tower表3 WRF模拟风速与测风塔风速对比验证指标 |
| 测风塔 | 年均观测风速/(m/s) | 年均模拟风速/(m/s) | EMB/(m/s) | ERMS/(m/s) | IA |
|---|---|---|---|---|---|
| 1822# | 6.80 | 6.96 | 0.16 | 2.97 | 0.81 |
| 1823# | 6.90 | 6.84 | -0.06 | 3.06 | 0.80 |
2.2 风资源评估
Fig. 2 Layout of virtual wind measurement towers in D03 region (a) and D04 region (b) with wind speed and wind direction diagrams图2 D03区域(a)和D04区域(b)虚拟测风塔布置及风速、风向示意图 |
Table 4 The annual average wind speed and wind power density at 110 m height in D03 and D04 regions表4 D03、D04区域110 m高度年均风速、风功率密度 |
| 虚拟测风塔 | 年均风速/(m/s) | 年均风功率密度/(W/m2) |
|---|---|---|
| D03 1# | 6.39 | 253.8 |
| D03 2# | 6.81 | 308.2 |
| D03 3# | 6.43 | 280.0 |
| D03 4# | 6.02 | 280.2 |
| D03 5# | 6.19 | 301.0 |
| D03 6# | 5.65 | 251.2 |
| D04 1# | 7.03 | 385.8 |
| D04 2# | 6.93 | 338.1 |
| D04 3# | 7.52 | 366.4 |
Fig. 3 Monthly average wind speed and wind power density of virtual wind measurement towers D03 2# and D04 1#图3 D03 2#、D04 1# 虚拟测风塔月均风速及风功率变化 |
2.3 大气稳定度分布
Table 5 Proportion of atmospheric stability states throughout the year at each virtual wind measurement tower表5 各虚拟测风塔全年大气稳定状态占比 |
| 虚拟测风塔 | 状态占比/% | ||||
|---|---|---|---|---|---|
| 强不稳定 | 不稳定 | 中性 | 稳定 | 强稳定 | |
| D03 1# | 32.3 | 5.3 | 11.3 | 3.9 | 47.3 |
| D03 2# | 30.5 | 5.2 | 14.5 | 5.3 | 44.5 |
| D03 3# | 31.1 | 5.1 | 13.1 | 4.1 | 46.6 |
| D03 4# | 31.8 | 4.7 | 12.8 | 4.7 | 46.0 |
| D03 5# | 30.0 | 5.0 | 15.7 | 4.5 | 44.8 |
| D03 6# | 33.2 | 4.2 | 11.6 | 3.9 | 47.2 |
| D04 1# | 27.8 | 6.1 | 22.2 | 5.9 | 38.0 |
| D04 2# | 29.2 | 6.6 | 21.6 | 6.4 | 36.2 |
| D04 3# | 19.6 | 9.5 | 34.0 | 7.5 | 29.4 |
Fig. 4 Topographic map of D04 region图4 D04区域地形图 |
Fig. 5 Seasonal variation in the distribution of atmospheric stability states for virtual wind measurement towers D03 2#, 6# and D04 1#, 3#图5 D03 2#、6#,D04 1#、3# 虚拟测风塔大气稳定状态分布季节变化 |
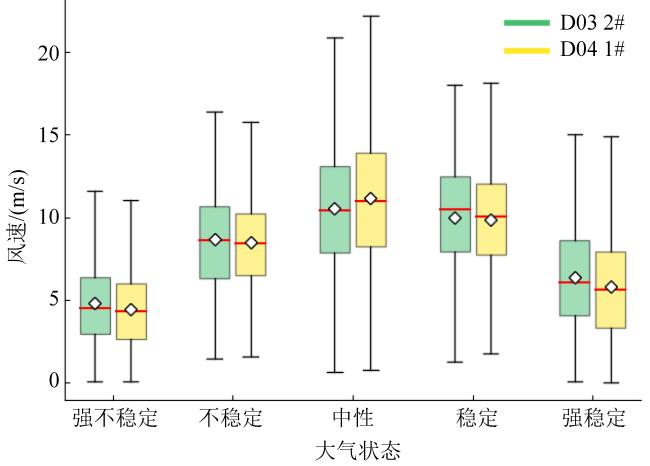
Fig. 6 Boxplot of wind speed at 110 m height for virtual wind measurement towers D03 2# and D04 1# under varying atmospheric stability conditions图6 D03 2#、D04 1# 虚拟测风塔110 m高度风速随大气稳定状态变化箱线图 |


