Welcome to visit Advances in New and Renewable Energy!
ISSN 2095-560X
CN 44-1698/TK
CONDEN XJIIA8
Toggle navigation
Home
About Journal
Editorial Board
Instruction
Journal Online
Current Issue
Just Accepted
Archive
Most Read
Most Download
Most Cited
E-mail Alert
Subscription
Download
Contact Us
中文
More options
Journal
DOI
ALL
Advances in New and Renewable Energy
Publication year from
To
All
2013
2014
2015
2016
2017
2018
2019
2020
2021
2022
2023
2024
2025
All
2025
2024
2023
2022
2021
2020
2019
2018
2017
2016
2015
2014
2013
Volume
Issue
Author
Affiliation
Search result
Journal
Loading ...
Publication year
Loading ...
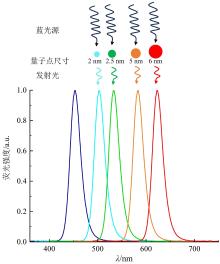
Fig. 1
Wavelength tunability of quantum dot materials
[
16
]
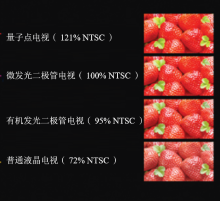
Fig. 2
The impact of color gamut on display performance
[
15
]
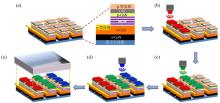
Fig. 3
The process flow of the full-color emission of quantum-dot based Micro LED display
[
54
]
Fig. 4
(a-e) Fabrication process of hybrid quantum dot-nanoring Micro LED; (f) Micro LED device cross-sectional structure diagram
[
58
]
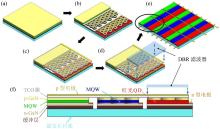
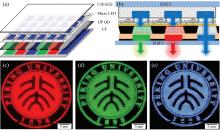
Fig. 5
(a) Schematic diagram of the structure of the perovskite quantum dot Micro LED device; (b) Micro LED device cross-sectional structure; (c-e) red and green quantum dot color conversion layer photoluminescence diagram and blue LED electroluminescence diagram
[
60
]
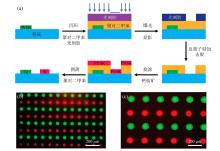
Fig. 6
(a) Process flow of manufacturing perovskite quantum dot layer by dry lift-off lithography; (b) fluorescence microscopy images of green and red perovskite quantum dot rings with a diameter of 50 μm; (c) fluorescence microscope image of quantum dot rings at high magnification
[
68
]
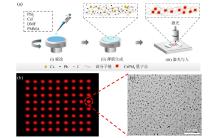
Fig. 7
(a) Process flow for preparing CsPbI
3
perovskite quantum dot layer by in situ laser direct writing; (b) CsPbI
3
quantum dot patterns obtained under UV-365 nm illumination; (c) TEM image of resulting
γ
-CsPbI
3
PQDs obtained from direct laser writing
[
71
]
Fig. 2
Flowchart of the solution process
Fig. 8
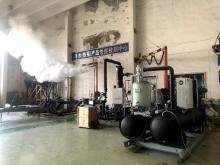
The first steam heat pump steam unit in China
Table 1 Thermophysical properties of phase change material and solid material
Fig. 4
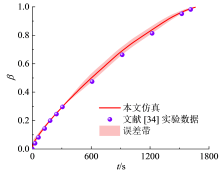
Comparison of experimental and numerical results for liquid fraction
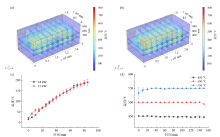
Fig. 5
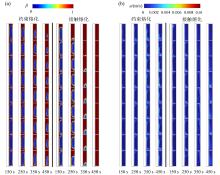
Evolutionary characteristics of solid-liquid phase change behavior under different melting modes: (a) liquid fraction; (b) velocity distribution
Fig. 6
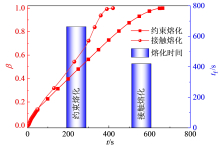
Liquid fraction and complete melting time in different melting modes
Fig. 7
Characteristics of dynamic temperature distribution in different melting modes
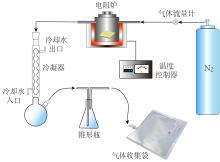
Fig. 1
Schematic diagram of pyrolysis device
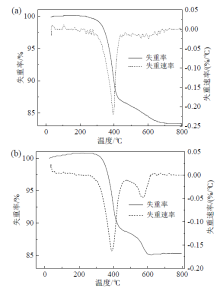
Fig. 2
TG and DTG curves of wind turbine blades: (a) N
2
-10 °C/min; (b) O
2
-10 °C/min
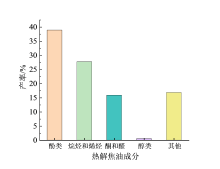
Fig. 3
The yield of each component of pyrolysis tar
Fig. 7
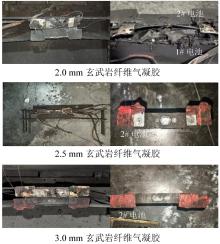
Post-test disassembly images of batteries using basalt fiber aerogel
Fig. 2
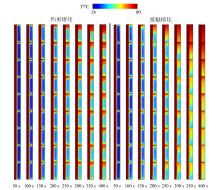
Variation of reactor temperature with material residence time: temperature distribution of microwave pyrolysis furnace temperature field at 12 kW (a) and 18 kW (b) power; microwave pyrolysis furnace wall (c) and oxidation furnace (d) temperature measurement
Table 2 Electrochemical properties of biomass-based biochar materials doped with heterons
page
Page 1 of 7
Total 128 records
First page
Prev page
Next page
Last page